Sponsor Area
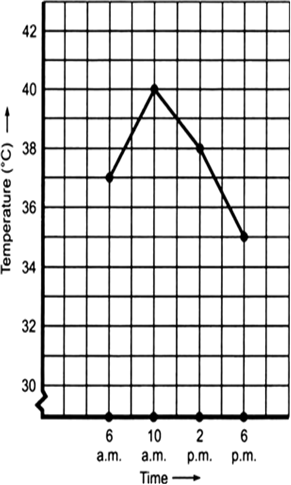
The following graph shows the temperature of a patient in a hospital, recorded every hour.
(a) What was the patient’s temperature at 1 p.m.?
(b) When was the patient’s temperature 38.5° C?
(c) The patient’s temperature was the same two times during the period given. What were these two times?
(d) What was the temperature at 1.30 p.m.? How did you arrive at your answer?
(e) During which periods did the patients’ temperature showed an upward trend?
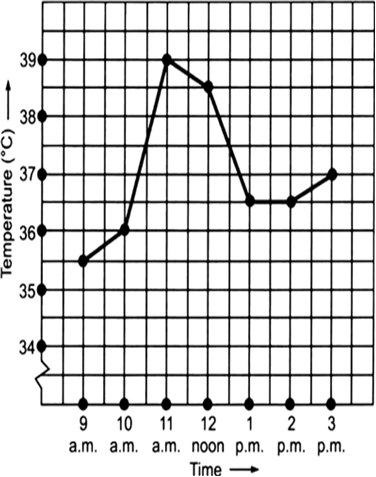
(a) The patient’s temperature at 1 p.m. was 36.5°.
(b) The patient's temperature 38.5° C was at 12 noon.
(c) The patient's temperature was same at 1 p.m. and 2 p.m.
(d) The patient’s temperature at 1:30 p.m. was 36.5° C [because the temperature of the patient was constant (i.e. 36.5° C) from 1 p.m. to 2 p.m.].
(e) The temperature of patient showed an upward trend during 9 a.m to 10 a.m. to 11 a.m. and 2 p.m. to 3 p.m.
The following line graph shows the yearly sales figures for a manufacturing company.
(a) What were the sales in (i) 2002 and (ii) 2006?
(b) What were the sales in (i) 2003 and (ii) 2005?
(c) Compute the difference between the sales in 2002 and 2006.
(d) In which year was there the greatest difference between the sales as compared to its previous year?
(a) (i) Company's sale in 2002 was Rs 4 crores.
(ii) Company’s sale in 2006 was Rs 8 crores.
(b) (i) Company’s sale in 2003 was Rs 7 crores.
(ii) Company’s sale in 2005 was Rs 10 crores.
(c) Difference between the sales in 2002 and 2006 = [Rs 8 crores] – [Rs 4 crores]
= Rs 4 crores
(d) The greatest difference between the sales of two consecutive years 2004 and 2005.
(a) How high was plant A after (i) 2 weeks and (ii) 3 weeks?
(b) How high was plant B after (i) 2 weeks and (ii) 3 weeks?
(c) How much did plant A grow during the 3rd week?
(d) How much did plant B grow from the end of the 2nd week to the end of the 3rd week?
(e) During which week did plant A grow most?
(f) During which week did plant B grow least?
(g) Were the two plants of the same height during any week shown here? Specify.
(a) (i) After 2 weeks: The plant A was 7 cm high. (ii) After 3 weeks:The plant A was 9 cm high.
(b) (i) After 2 weeks: The plant B was 7 cm high. (ii) After 3 weeks: The plant B was 10 cm high.
(c) During the 3rd week, the plant grew (9 cm – 7 cm), i.e. 2 cm.
(d) The plant B grew 10 cm – 7 cm = 3 cm from the end of 2nd week to the end of the 3rd week.
(e) The growth of the plant A:
During the 1st week = 1 cm – 0 cm = 1 cm, During the 2nd week = 7 cm – 1 cm = 6 cm, During the 3rd week = 9 cm – 7 cm = 2 cm. Thus, during the 2nd week, the plant A grew the must.
(f) The growth of the plant B during:
the 1st week = 1 cm – 0 cm = 1 cm
the 2nd week = 7 cm – 1 cm = 6 cm
the 3rd week = 10 cm – 7 cm = 3 cm
Thus, the plant-B grew the least in the first week.
(g) Both the plants have shown almost the same height at the end of the 2nd week.
The following graph shows the temperature forecast and the actual temperature for each day of a week.
(a) On which days was the forecast temperature the same as the actual temperature?
(b) What was the maximum forecast temperature during the week?
(c) What was the minimum actual temperature during the week?
(d) On which day did the actual temperature differ the most from the forecast temperature?
(a) The forecast temperature was the same as the actual temperature on Tuesday, Friday and Sunday.
(b) The maximum forecast temperature during the week was 35° C.
(c) The maximum actual temperature during the week was 15° C.
(d) Difference between the actual temperature and the forecast temperature on
Monday = 17.5° C – 15° C = 2.5° C
Tuesday = 20.5° C – 20° C = 0.5° C
Wednesday = 30.0° C – 25° C = 5° C
Thursday = 22.5° C – 15° C = 7.5° C
Friday = 15° C – 15° C = 0° C
Saturday = 30° C – 25° C = 5° C
Sunday = 35° C – 35° C = 0° C
Thus, the maximum difference was on Tuesday.
Population (in thousands) of men and women in a village in different years.
A courier-person cycles from a town to a neighbouring suburban area to deliver a parcel to a merchant. His distance from the town at different times is shown by the following graph.
(a) What is the scale taken for the time axis?
(b) How much time did the person take for the travel?
(c) How far is the place of the merchant from the town?
(d) Did the person stop on his way? Explain.
(e) During which period did he ride fastest?
In case of (iii), there are an infinite number of temperature at the same time which is not possible.
∴ Case (iii) does not represent a time-temperature graph.
Ratana fell sick. Her doctor maintained a record of her hody temperature, taken every four hours. It is shown in the following time-temperature graph.
(a) During which period the temperature showed a rising trend?
(b) During which period the temperature showed a downward trend?
(c) At what time the temperature was highest?
(d) At what time the temperature was lowest?
Solution not provided.
Ans. (a) 6 a.m. to 10 a.m.
(b) 10 a.m. to 6 p.m.
(c) 10 a.m.
(d) 6 p.m.
Following graph represents the total runs scored by two batsmen A and B, during each of the ten different matches in the year 2007. Study the graph and answer the following questions.
(a) What information is given on the two axes?
(b) Which line shows the runs scored by batsman A?
(c) Where the run scored by them same in any match in 2007? If so, in which match?
(d) Among the two batsmen, who is steadier? How do you judge it?
Solution not provided.
Ans. (a) x-axis March played during the year 2007.
y-axis Total runs scored in each match.
(b) The dotted line
(c) Yes, in the 4th march
(d) Batsman B
(a) What information is given on the two axes?
(b) From where and when did the car begin its journey?
(c) How far did the car go in the first hour?
(d) How far did the car go during (i) the 2nd hour? (ii) the 3rd hour?
(e) Was the speed same during the first three hours? How do you know it?
(f) Did the car stop for some duration at any place? Justify your answer.
(g) When did the car reach City Q?
(a) x-axis time; y-axis
Distance from p
(b) At 8: a.m. from city-p
(c) 50 km
(d) (i) 100 km (from 50 km, 5 to 150 km)
(ii) 50 km(150 km to 200 km)
(e) It was same during 1st, 2nd hour and 3rd year.
(f) Yes, no distance covered during 11 a.m. to 12 noon.
(g) At 2 p.m.
Plot the following points on a graph sheet. Verify if they lie on a line:
(a) A (4, 0), B(4, 2), C(4, 6), D(4, 2.5)
(b) P(1, 1), Q(2, 2), R(3, 3), S(4, 4)
(c) K(2, 3), L(5, 3), M(5, 5), N(2, 5)
In each case we draw the x-axis and the y-axis and plot the given point.
(a) on plotting the points A(4, 0), B(4, 2), C(4, 6) and D(4, 2.5) and then joining them we find that they all lie on the same line.
(b) On plotting the points P(1, 1), Q(2, 2), R(3, 3) and S(4, 4) and then joining them we find that they all lie on the same line.
(c) Plotting the points k(2, 3) L(5, 3), M(5, 5) and N(2, 5) and joining them we find that all of them do not lie on the same line.
(i) The co-ordinates of :
O are (0, 0)
A are (2, 0)
B are (2, 3)
C are (0, 3)
(ii) The co-ordinates of :
P are (4, 3)
Q are (6, 1)
R are (6, 5)
S are (4, 7)
(iii) The co-ordinates of:
K are (10, 5)
L are (7, 7)
M are (10, 8)
A.
A point whose x coordinate is zero and y-coordinate is non-zero will lie on the y-axis.B.
A point whose y coordinate is zero and x-coordinate is 5 will lie on y-axis.C.
The coordinates of the origin are (0, 0).Since, quantity of petrol is a need whereas the amount of money is linked with the quantity of petrol.
Petrol is the independent variable.
We draw axes and take a suitable scale on both the axes. To draw the graph, we take the following steps:
I. Mark the number litres of petrol along the horizontal axis.
II. Mark the cost of petrol (in rupees) along the y-axis.
III. Now, we plot the given points, i.e.
(10, 500); (15, 750); (20, 1000); (25, 1250)
IV. Join the points.
We find that the graph is a straight line.
Yes, we can find the quantity of petrol to be got in Rs 800, for this take a point on the y-axis (0,800). Through A draw BC parallel to x-axis to meet the graph at B. Now from B, draw BC Perpendicular x-axis.
As C corresponds to (16, 0).
Thus, 16 litre petrol can be bought for Rs 800.
Sponsor Area
I. Draw x-axis and y-axis mutually perpendicular to each other.
II. Take a suitable scale.
III. Take the number of apples along the x-axis and mark the cost (in Rs) along the y-axis.
IV. Plot the points (1, 5), (2, 10), (3, 15), (4, 20) and (5, 25).
V. Joint the points.
We obtain the graph a straight line.
(i) How much distance did the car cover during the period 7.30 a.m. to 8 a.m.?
(ii) What was the time when the car had covered a distance of 100 km since it’s start?
Steps:
I. Draw the axis.
II. Choose suitable scale along x-axis and along y-axis.
III.Mark time (in hours) along x-axis and distance (in km) along y-axis
IV.Plot the points (6, 40) (7, 80), (8, 120) and (9, 160).
V. By joining the points we get the required graph.
(i) In the graph, draw a perpendicular at the point indicating 7:30 a.m. on the x-axis such that it meets the graph at A. From A draw a line parallel to x-axis to meet y-axis at 100 km.
∴ Distance travelled between 7:30 a.m. and 8:00 a.m.
= 120 km – 100 km
= 20 km
(ii) 7:30 a.m.
Steps:
I. Draw axes.
II. Take appropriate scale on x-axis and y-axis.
III. Mark the deposits along the x-axis.
IV. Mark the interest along the y-axis.
V. Plot the point (1000, 80) (2000, 160), (3000, 240), (4000, 320) and (5000, 400).
VI. Join the points and get the graph.
Now from the graph, we have:
(i) Yes, it passes through the origin.
(ii) From the graph, the interest on Rs 2500 is Rs 200.
(iii) From the graph an interest of Rs 280 can be got by depositing Rs 3500.
Taking the side of the square along the x-axis and the perimeter along the y-axis and plotting the points (2, 8), (3, 12), (3.5, 14), (5, 20) and (6, 24), we get the required graph as a straight line.
∴ This graph is a linear graph.
∴ The graph is not a straight line.
∴ It is not a linear graph.
Plot the point (4, 3) on a graph sheet. Is it the same as the point (3, 4)?
Solution not provided.
Ans. No
Choose the letter(s) that indicate the location of the points given below:
(i) (2,1) (ii) (0,5) (iii) (2,0)
Also write the co-ordinates of: (iv) A (v) F
Solution not provided.
Ans. No
Solution not provided.
Ans. (i) E
(ii) B
(iii) G
(iv) (4, 5)
(v) (5.5, 0)
A bank gives 10% simple interest (S.I.) on deposits by senior citizens. Draw a graph to show the relation between the sum deposited and simple interest earned. Find from your graph.
(i) The annual interest for an investment of Rs 250.
(ii) The investment one has to make to get an annual simple interest of Rs 70.
Solution not provided.
Ans. (i) Rs 25
(ii) Rs 700
From the figure, we have
The co-ordinates of P are (0, 4). The co-ordinates of Q are (5, 5). The co-ordinates of R are (10, 3). The co-ordinates of S are (10, 2). The co-ordinates of T are (8, 0).
By plotting the points (7:00, 60), (8:00, 120), (9:00, 180) and (10:00, 240), we get a straight line.
(i) Distance covered during 7:00 and 8:00 = (180 – 120) km = 60 km.
(ii) From the graph the car would have covered 180 km at 9:00.
From the graph, the vertices of ∆ABC are: A, B and C. We find that
The co-ordinates of A are (2, 5).
The co-ordinates of B are (2, 1).
The co-ordinates of C are (5, 1).
The required triangle with vertices as A(5, 2), B(1, 2) and C(1, 5) is given in the following graph.
(i) What is the distance between town A and town D?
(ii) When did the car start from town A?
(iii) Where did the car stop and for what duration?
(iv) How long did it take to go from town C to town D?
(i) The distance between the town A and town D is 500 km - 100 km = 400 km.
(ii) The car started from the town A at 5 a.m.
(iii) The car stopped at town B for 1 hour (7 a.m. to 8 a.m.).
(iv) The car look 2 hours to reach from town C to town D.
Read the following ‘time-temperature’ graph of a place and answer the questions given below.
(i) What was the temperature at 7 a.m.?
(ii) When the temperature was maximum?
(iii) When was the temperature 40°C?
(iv) During which period, the temperature remained constant?
(i) At 7 a.m., the temperature was 34° C.
(ii) The maximum temperature (44° C) was at 11 a.m.
(iii) At 10 a.m., the temperature was 40° C.
(iv) The temperature remained constant during 8 a.m. to 9 a.m.
(i) What was patient’s temperature at 9 a.m.?
(ii) What the highest temperature of the patient?
(iii) When was the patient’s temperature lowest?
(iv) During which period, the patient's temperature remained constant?
Solution not provided.
Ans.
(iiii) 11 a.m.
(iv) 7 a.m. to 8 a.m.
(i) What were the sales in 2000?
(ii) In which year the sales were maximum?
(iii) What is the difference between the sales in the year 2003 and 2005?
Solution not provided.
Ans. (i) 10 crores
(ii) in 2002 and 2005
(iii) 0
Sponsor Area
Solution not provided.
Ans. Yes
Solution not provided.
Ans. x-axis: (9, 0) and y-axis (0, 9)
Solution not provided.
Ans. A(2, 4), B(2, 2), C(7, 2), D(7, 4)
Solution not provided.
Ans. Rs 600
B.
the different pointsB.
4 is the x coordinatesC.
equidistance from x-axis and y-axisB.
a straight lineSponsor Area
Sponsor Area