Question
Following graph represents the total runs scored by two batsmen A and B, during each of the ten different matches in the year 2007. Study the graph and answer the following questions.
(a) What information is given on the two axes?
(b) Which line shows the runs scored by batsman A?
(c) Where the run scored by them same in any match in 2007? If so, in which match?
(d) Among the two batsmen, who is steadier? How do you judge it?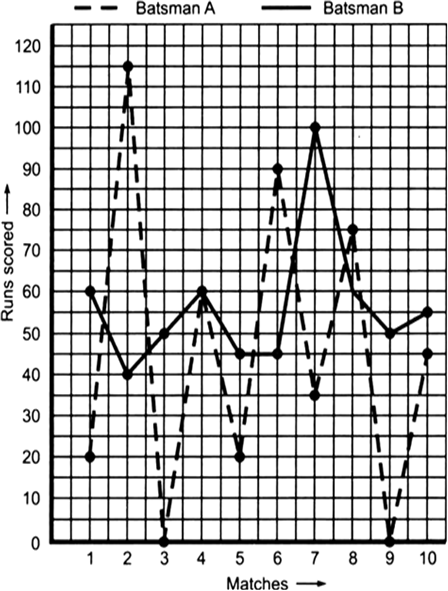
Solution
Solution not provided.
Ans. (a) x-axis  March played during the year 2007.
y-axis  Total runs scored in each match.
(b) The dotted line
(c) Yes, in the 4th march
(d) Batsman B