Question
Draw the graphs for the following tables of values, with suitable scales on the axes,
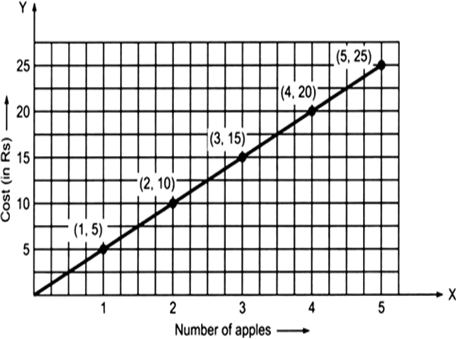
Cost of apples

Solution
I. Draw x-axis and y-axis mutually perpendicular to each other.
II. Take a suitable scale.
III. Take the number of apples along the x-axis and mark the cost (in Rs) along the y-axis.
IV. Plot the points (1, 5), (2, 10), (3, 15), (4, 20) and (5, 25).
V. Joint the points.
We obtain the graph a straight line.