Question
The following table gives the quantity of petrol and its cost.

Plot a graph to show the data.
Use the graph to find how much petrol can be purchased for Rs 800.
Solution
We draw axes and take a suitable scale on both the axes. To draw the graph, we take the following steps:
I. Mark the number litres of petrol along the horizontal axis.
II. Mark the cost of petrol (in rupees) along the y-axis.
III. Now, we plot the given points, i.e.
(10, 500); (15, 750); (20, 1000); (25, 1250)
IV. Join the points.
We find that the graph is a straight line.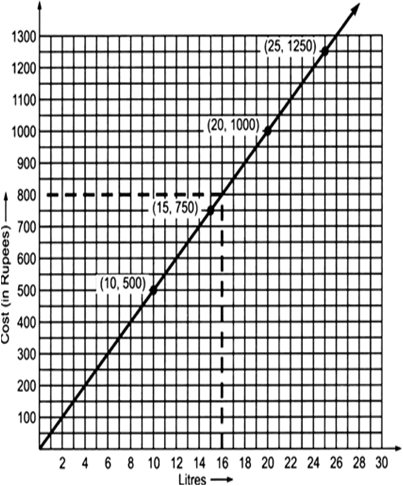
Yes, we can find the quantity of petrol to be got in Rs 800, for this take a point on the y-axis (0,800). Through A draw BC parallel to x-axis to meet the graph at B. Now from B, draw BC Perpendicular x-axis.
As C corresponds to (16, 0).
Thus, 16 litre petrol can be bought for Rs 800.