Question
Ratana fell sick. Her doctor maintained a record of her hody temperature, taken every four hours. It is shown in the following time-temperature graph.
(a) During which period the temperature showed a rising trend?
(b) During which period the temperature showed a downward trend?
(c) At what time the temperature was highest?
(d) At what time the temperature was lowest?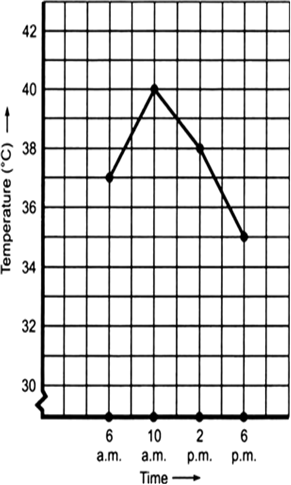
Solution
Solution not provided.
Ans. (a) 6 a.m. to 10 a.m.
(b) 10 a.m. to 6 p.m.
(c) 10 a.m.
(d) 6 p.m.