Question
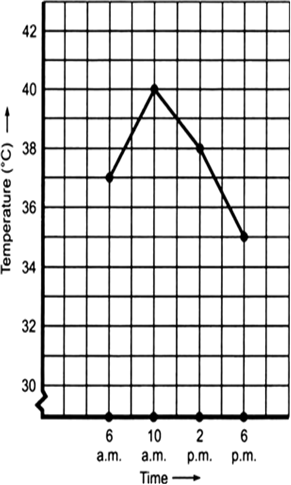
A courier-person cycles from a town to a neighbouring suburban area to deliver a parcel to a merchant. His distance from the town at different times is shown by the following graph.
(a) What is the scale taken for the time axis?
(b) How much time did the person take for the travel?
(c) How far is the place of the merchant from the town?
(d) Did the person stop on his way? Explain.
(e) During which period did he ride fastest?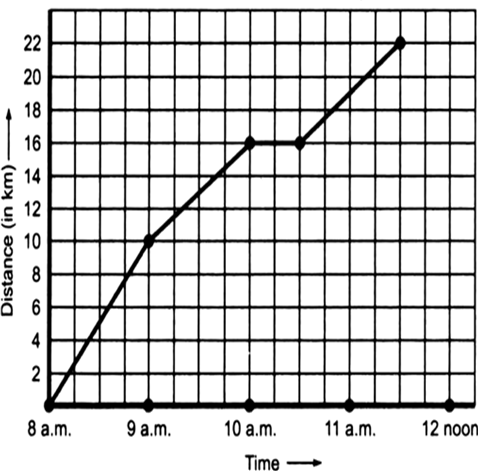
Solution
(a) The time is taken along the x-axis. The scale along x-axis is 4 units = 1 hour
(b) Total travel time = 8 a.m. to 11:30 a.m. =
(c) Distance of the merchant from the town = 22 km.
(d) Yes, the stopage time = 10:00 a.m. to 10.30 a.m.
(e) His fast ride is between 8:00 a.m. and 9:00 a.m.
(b) Total travel time = 8 a.m. to 11:30 a.m. =
(c) Distance of the merchant from the town = 22 km.
(d) Yes, the stopage time = 10:00 a.m. to 10.30 a.m.
(e) His fast ride is between 8:00 a.m. and 9:00 a.m.