Question
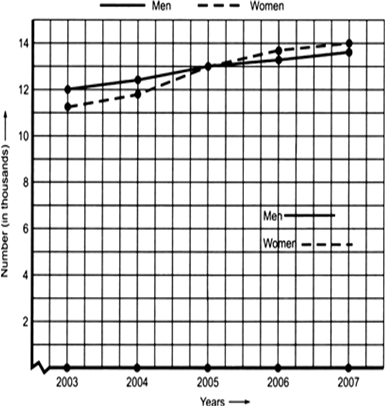
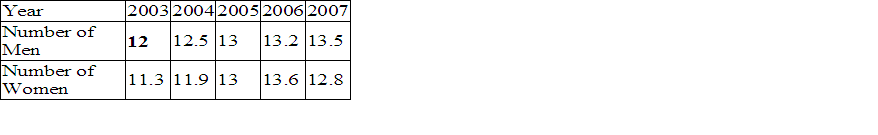
Population (in thousands) of men and women in a village in different years.
Solution
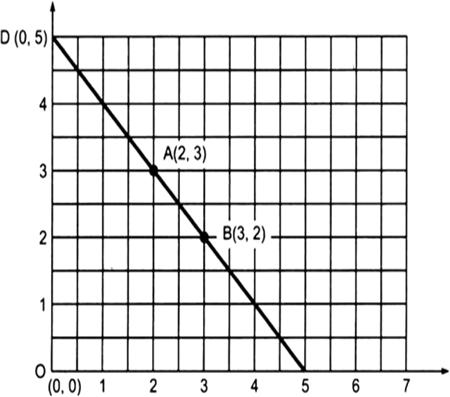
Linear graph showing population of men and women in a village in different years: