For an experiment in Botany, two different plants, plant A and B were grown under similar laboratory conditions. Their height were measured at the end of each week for 3 weeks. The results are shown by the following graph.
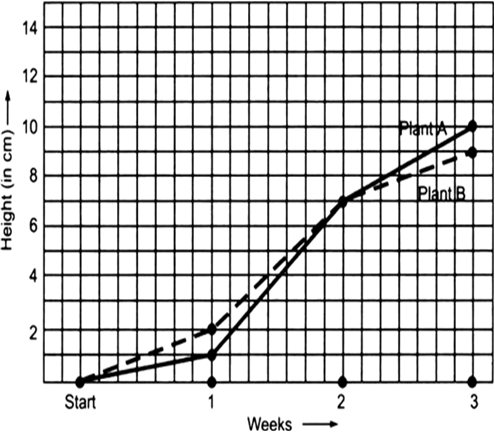
(a) How high was plant A after (i) 2 weeks and (ii) 3 weeks?
(b) How high was plant B after (i) 2 weeks and (ii) 3 weeks?
(c) How much did plant A grow during the 3rd week?
(d) How much did plant B grow from the end of the 2nd week to the end of the 3rd week?
(e) During which week did plant A grow most?
(f) During which week did plant B grow least?
(g) Were the two plants of the same height during any week shown here? Specify.
(a) (i) After 2 weeks: The plant A was 7 cm high. (ii) After 3 weeks:The plant A was 9 cm high.
(b) (i) After 2 weeks: The plant B was 7 cm high. (ii) After 3 weeks: The plant B was 10 cm high.
(c) During the 3rd week, the plant grew (9 cm – 7 cm), i.e. 2 cm.
(d) The plant B grew 10 cm – 7 cm = 3 cm from the end of 2nd week to the end of the 3rd week.
(e) The growth of the plant A:
During the 1st week = 1 cm – 0 cm = 1 cm, During the 2nd week = 7 cm – 1 cm = 6 cm, During the 3rd week = 9 cm – 7 cm = 2 cm. Thus, during the 2nd week, the plant A grew the must.
(f) The growth of the plant B during:
the 1st week = 1 cm – 0 cm = 1 cm
the 2nd week = 7 cm – 1 cm = 6 cm
the 3rd week = 10 cm – 7 cm = 3 cm
Thus, the plant-B grew the least in the first week.
(g) Both the plants have shown almost the same height at the end of the 2nd week.