The following graph shows the temperature forecast and the actual temperature for each day of a week.
(a) On which days was the forecast temperature the same as the actual temperature?
(b) What was the maximum forecast temperature during the week?
(c) What was the minimum actual temperature during the week?
(d) On which day did the actual temperature differ the most from the forecast temperature?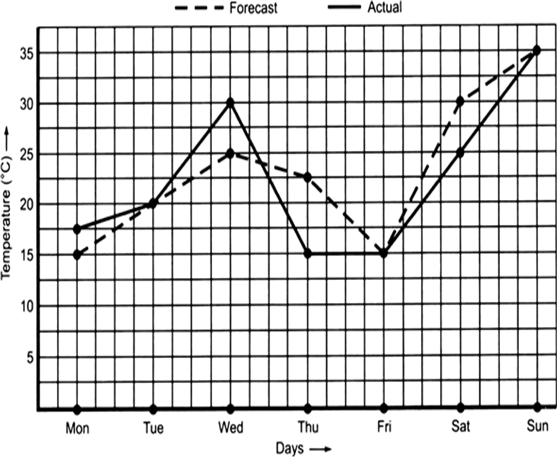
(a) The forecast temperature was the same as the actual temperature on Tuesday, Friday and Sunday.
(b) The maximum forecast temperature during the week was 35° C.
(c) The maximum actual temperature during the week was 15° C.
(d) Difference between the actual temperature and the forecast temperature on
Monday = 17.5° C – 15° C = 2.5° C
Tuesday = 20.5° C – 20° C = 0.5° C
Wednesday = 30.0° C – 25° C = 5° C
Thursday = 22.5° C – 15° C = 7.5° C
Friday = 15° C – 15° C = 0° C
Saturday = 30° C – 25° C = 5° C
Sunday = 35° C – 35° C = 0° C
Thus, the maximum difference was on Tuesday.