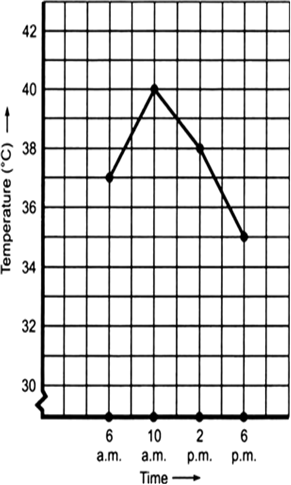
The following graph shows the temperature of a patient in a hospital, recorded every hour.
(a) What was the patient’s temperature at 1 p.m.?
(b) When was the patient’s temperature 38.5° C?
(c) The patient’s temperature was the same two times during the period given. What were these two times?
(d) What was the temperature at 1.30 p.m.? How did you arrive at your answer?
(e) During which periods did the patients’ temperature showed an upward trend?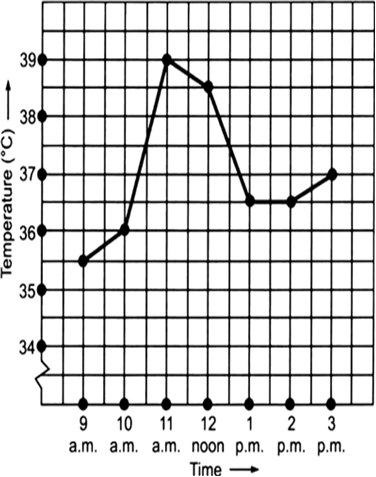
(a) The patient’s temperature at 1 p.m. was 36.5°.
(b) The patient's temperature 38.5° C was at 12 noon.
(c) The patient's temperature was same at 1 p.m. and 2 p.m.
(d) The patient’s temperature at 1:30 p.m. was 36.5° C [because the temperature of the patient was constant (i.e. 36.5° C) from 1 p.m. to 2 p.m.].
(e) The temperature of patient showed an upward trend during 9 a.m to 10 a.m. to 11 a.m. and 2 p.m. to 3 p.m.