Sponsor Area
Let E be the event of hitting the boundary.
Then,
∴ Probability of not hitting the boundary
= 1 – Probability of hitting the boundary
= 1 – P(E) = 1 – 0.2 = 0.8.
1500 families with 2 children were selected randomly, and the following data were recorded:
|
Number of girls in a family |
2 |
1 |
0 |
|
Number of families |
475 |
814 |
211 |
Compute the probability of a family, chosen at random, having
(0 2 girls (ii) 1 girl (iii) No girl.
Also check whether the sum of these probabilities is 1.
Total number of families
= 475 + 814 + 211 = 1500
(i) Probability of a family, chosen at random,
having 2 girls = 
(ii) Probability of a family, chosen at random,
having 1 girl 
(iii) Probability of a family, chosen at random,
having no girl 
Sum of these probabilities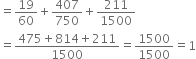
Hence, the sum is checked.
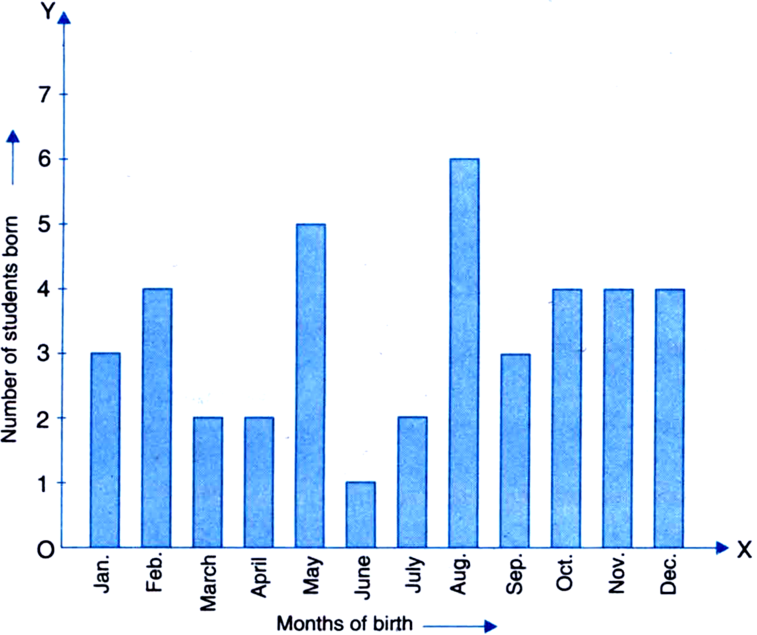
Total number of students bom in the year =3+4+2+2+5+1+2+6+3+4+4+4=40
Number of students bom in August = 6
∴ Probability that a student of the class was
born in August = 
Three coins are tossed simultaneously 200 times with the following frequencies of different outcomes:
|
Outcome |
3 heads |
2 heads |
1 head |
No head |
|
Frequency |
23 |
72 |
71 |
28 |
If the three coins are simultaneously tossed again, compute the probability of 2 heads coming up.
Total number of times the three coins are tossed = 200
Number of times when 2 heads appear = 72
∴ Probability of 2 heads coming up
An organisation selected 2400 families at random and surveyed them to determine a relationship between income level and the number of vehicles in a family. The information gathered is listed in the table below:
|
Monthly income |
Vehicles per family |
|||
|
(in र) |
0 |
1 |
2 |
Above 2 |
|
Less than 7000 |
10 |
160 |
25 |
0 |
|
7000-10000 |
0 |
305 |
27 |
2 |
|
10000-13000 |
1 |
535 |
29 |
1 |
|
13000–16000 |
2 |
469 |
59 |
25 |
|
16000 or more |
1 |
579 |
82 |
88 |
Suppose a family is chosen. Find the probability that the family chosen is
(i) earning र 10000–13000 per month and owning exactly 2 vehicles.
(ii) earning र 16000 or more per month and owning exactly l vehicle.
(iii) earning less than र 7000 per month and does not own any vehicle.
(iv) earning र 13000–16000 per month and owning more than 2 vehicles.
(v) owning not more than I vehicle.
Total number of families selected = 2400
(i) Number of families earning र10000–13000 per month and owning exactly 2 vehicles = 29
∴ Probability that the family chosen is earning र10000–13000 per month and owning
exactly 2 vehicles = 
(ii) Number of families earning र16000 or more per month and owning exactly 1 vehicle = 579
∴ Probability that the family chosen is earning र16000 or more per month and owning
exactly 1 vehicle = 
(iii) Number of families earning less than र 7000 per month and does not own any vehicle =10
Probability that the family chosen is earning less than र7000 per month and does not own any vehicle = 
(iv) Number of families earning र13000–16000 per month and owning more than 2 vehicles = 25
∴ Probability that the family chosen is earning र13000–16000 per month and owning
more than 2 vehicles = 
(v) Number of families owning not more than 1 vehicle
= Number of families owning 0 vehicle + Number of families owning 1 vehicle = (10 + 0+ 1 + 2 + 1) +(160 + 305 + 535 + 469 +579) = 14 + 2048 = 2062
∴ Probability that the family chosen owns not more than 1 vehicle = 
|
Marks (out of 100) |
Number of students |
|
0-20 |
7 |
|
20-30 |
10 |
|
30-40 |
10 |
|
40-50 |
20 |
|
50-60 |
20 |
|
60-70 |
15 |
|
70–above |
8 |
|
Total |
90 |
(i) Find the probability that a student obtained less than 20% in the mathematics test.
(ii) Find the probability that a student obtained marks 60 or above.
Total number of students = 90
(i) Number of students obtaining less than 20% in the mathematics test = 7
∴ Probability that a student obtained less than 20% in mathematics test = 
(ii) Number of students obtaining marks 60 or above = 15 + 8 = 23
Probability that a student obtained marks 60 or = 
To know the opinion of the students about the subject statistics, a survey of 200 students was conducted. The data is recorded in the following table:
|
Opinion |
Number of students |
|
like dislike |
135 65 |
Find the probability that a student chosen at random
(i) likes statistics,
(ii) does not like it.
Total number of students = 200
(i) Number of students who like statistics = 135 Probability that a student chosen at random like statistics = 
(ii) Number of students who do not like statistics = 65
Probabi lity that a student chosen at random does not like it = 
Aliter: Probability that a student chosen at andom does like statistics
= 1 – probability that a student chosen at random likes statistics
Refer to Q.2, Exercise 14.2. What is the empirical probability that an engineer lives: (i) less than 7 km from her place of work? (ii) more than or equal to 7 km from her place of work? (iii) within  km from her place of work?
Total number of female engineers = 40
(i) Number of female engineers whose distance (in km) from their residence to their place of work is less than 7 km = 9.
∴ Probability that an engineer lives less than 7 km from her plae of work = 
(ii) Number of female engineers whose distance (in km) from their residence to their place of work is more than or equal to 7 km = 31.
∴Probability that an engineer lives more than or equal to 7 km from her place of residence 
Aliter: Probability that an engineer lives more than or equal to 7 km from her place of residence = 1 – probability that an engineer lives less than 7 km from her place of work 
(iii) Number of female engineers whose distance (in km) from their residence to their place of work is within 
 Probablity that an engineer lives within
  km from her place of work =
Sollution not provided.
Eleven bags of wheat flour, each marked 5 kg, actually contained the following weights of flour (in kg):
4.97 5.05 5.08 5.03 5.00 5.06 5.08 4.98 5.04 5.07 5.00
Find the probability that any of these bags chosen at random contains more than 5 kg of flour.
Total number of bags of wheat flour =11.
Number of bags of wheat flour containing more than 5 kg of flour = 7.
Probability that any of the bags, chosen at
random, contains more than 5 kg of flour = 
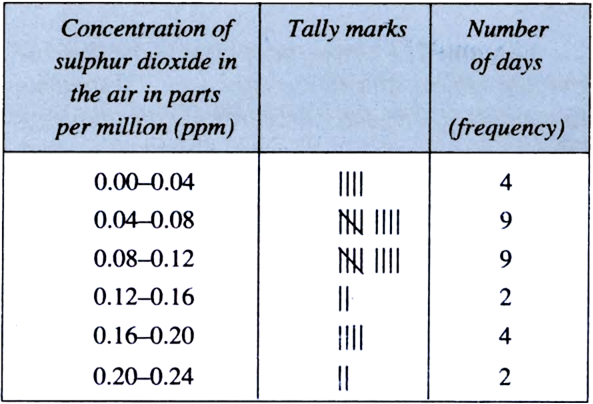
In Q.5, Exercise 14.2, you were asked to prepare a frequency distribution table, regarding the concentration of sulphur dioxide in the air in parts per million of a certain city for 30 days. Using this table, find the probability of the concentration of sulphur dioxide in the interval 0.12 - 0.16 on any of these days
Total number of days = 30
Number of days on which the concentration of sulphur dioxide is in the interval 0.12 – 0.16 = 2.
∴ Probability that the concentration of sulphur dioxide is in the interval 0.12–0.16 on any of these days 
In Q.1, Exercise 14.2, you were asked to prepare a frequency distribution table regarding the blood groups of 30 students of a class. Use this table to determine the probability that a student of this class, selected at random, has blood group AB.
Total number of students = 30
Number of students having blood groups AB = 3
∴ Probability that a student of this class, selected at random, has blood group
Frequency Distribution Table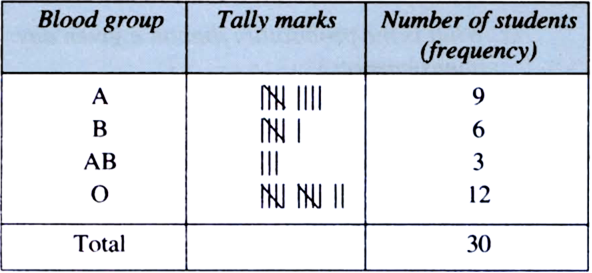
A and B are the only two outcomes of an event. Probability P(A) = 0.72 then what will be the probability P(B) and why?
P(A) + P(B) = 1
[  Sum of the probablities of all the outcomes of an event is 1]
A survey of 500 families was conducted to know their opinion about a particular detergent powder. If 375 families liked the detergent powder and the remaining families disliked it, find the probability that a family chosen at random
(i) likes the detergent powder
(ii) does not like it.
Total number of families = 500
(i) Number of families who like the detergent powder = 375
∴ Probability that a family chosen at random likes the detergent powder 
(ii) Number of families who dislike the detergent powder = 500 – 375 = 125
∴ Probability that a family chosen at random does not like the detergent powder
1500 families with 2 children were released randomly and the following data was recorded:
|
No. of girls |
No. of families |
|
0 1 2 |
211 814 475 |
If a family is chosen at random, find the probability that it has
(i) at most one girl
(ii) at least one girl
Total number of families = 1500
(i) at most one girl means 0 girl or 1 girl.
∴ Number of families which have at most one girl
= 211 +814= 1015
∴Probability that it has at most one girl
(ii) at least one girl means 1 girls or 2 girls.
∴ Number of families which have at least one girl
= 814 + 475 = 1289
∴ Probability that it has at least one girl
Out of the past 250 consecutive days, its weather forecasts were correct 175 times.
(i) What is the probability that on a given day it was correct?
(ii) What is the probability that it was not correct on a given day?
Total number of days = 250
(i) Number of days on which the weather forecasts were correct = 175
∴ Probability that on a given day it was correct
(ii) Probability that it was not correct on a given day 
Sponsor Area
A die is rolled 25 times and outcomes are recorded as under:
|
Outcomes |
Frequency |
|
1 |
9 |
|
2 |
4 |
|
3 |
5 |
|
4 |
6 |
|
5 |
1 |
|
6 |
0 |
It is thrown one more time. Find the probability of getting
(a) an even number
(b) a multiple of 3
(c) a prime number.
Total number of times a die is rolled = 25
(a) Even numbers are 2,4, 6.
∴ Probability of getting an even number
(b) Multiples of 3 are 3, 6.
∴ Probability of getting a multiple of 3
(c) 2, 3, 5 are prime numbers.
∴ Probability of getting a prime number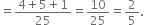
A bag contains 5 red balls, 8 white balls, 4 green balls and 7 black balls. If one ball is drawn at random, find the probability that it is
(i) black
(ii) not green.
In the bag,
number of red balls = 5
number of white balls = 8
number of green balls = 4
number of black balls = 7
∴ Total number of balls in the bag = 5 + 8 + 4 + 7 = 24
(i) Number of black balls = 7
∴ Probability that the ball drawn is black
(ii) Number of balls that are not green
= 5 + 8 + 7 = 20
∴ Probability that the ball drawn is not green
Cards marked with numbers 2 to 101 are placed in a box and mixed thoroughly. One card is drawn from this box. Find the probability that the number on the card is
(a) a number less than 14
(b) a number which is a perfect square
(c) a prime number less than 20.
Total number of cards in the box = 100 (a) Numbers less than 14 are
2, 3,4, 5. 6, 7, 8, 9, 10, 11,12, 13 Their number =12
∴ Probability that the number on the card is a number less than 14
(b) Perfect square numbers are
4, 9, 16,25, 36,49, 64,81, 100 Their number = 9
∴ Probability that the number on the card is a number which is a perfect square
(c) Prime numbers less than 20 are 2, 3, 5,7, 11, 13, 17, 19 Their number = 8
∴ Probability that the number in the card is a prime number less than 20
On a particular day, the number of vehicles passing through a crossing is given below:
|
Vehicle |
Frequency |
|
Two-wheeler |
57 |
|
Three-wheeler |
33 |
|
Four-wheeler |
30 |
A particular vehicle is chosen at random. What is the probability that it is not a four-wheeler?
Number of two wheelers = 57
Number of three wheelers = 33
Number of four wheelers = 30
∴ Total number of vehicles = 57 + 33 + 30 = 120
Number of vehicles that is not a four-wheeler
= 57 + 33 = 90
∴ Probability that the vehicle chosen at random is not a four-wheeler
30 plants were planted in each school out of 12 schools. After a month the number of plants that survived are given below:
|
School |
Number of plants survived |
|
1 |
22 |
|
2 |
15 |
|
3 |
12 |
|
4 |
24 |
|
5 |
27 |
|
6 |
10 |
|
7 |
13 |
|
8 |
22 |
|
9 |
17 |
|
10 |
9 |
|
11 |
20 |
|
12 |
25 |
What is the probability of survival of
(i) more than 20 plants in a school?
(ii) less than 10 plants in a school?
(iii) exactly 22 plants in a school?
Total number of schools =12
(i) Number of schools in which more than 20 plants survived = 5
∴ Probability of survival of more than 20 plants in a school 
(ii) Number of schools in which less than 10 plants survived = 1
∴ Probability of survival of less than 10 plants in a school = 
(iii) Number of schools in which exactly 22 plants survived = 2
Probability of survival of exactly 22 plants in a school = 
The percentages of marks obtained by a student in examination are given below:
|
Examination subjects |
% marks |
|
I |
58 |
|
11 |
64 |
|
III |
76 |
|
IV |
62 |
|
V |
85 |
Find the probability that the student gets
(i) a first class i.e. at least 60% marks
(ii) a distinction i.e. 75% or above
(ii) marks between 70% and 80%.
Total number of subjects = 5
(i) Number of subjects in which the student gets a first class = 4
∴ Probability that the students gets a first class 
(ii) Number of subjects in which the student gets a distinction = 2
∴ Probability that the student gets a distinction = 
(iii) Number of subjects in which the student gets marks between 70% and 80% = 2
∴ Probability that the students gets marks between 70% and 80% = 
At a hospital, a doctor compiled the following data about 400 patients whom he could cure of hepatitis:
|
Time for cure |
No. of patients |
|
< 1 month |
210 |
|
1–2 months |
105 |
|
2-3 months |
60 |
|
> 3 months |
25 |
Another case of hepatitis is reported. What is the probability that this patient will be cured in
(i) less than 2 months?
(ii) 1 month or more but not more than 3 months?
Total number of patients = 400
(i) Number of patients who were cured in less than 2 months = 210+ 105 = 315
∴ Probability that the patient will be cured in less than 2 months = 
(ii) Number of patients who were cured in 1 month or more but not more than 3 months
= 105 + 60 = 165
∴ Probability that the patient will be cured in
1 month or more but not more than 3 months 
An insurance company selected 1600 drivers at random in a particular city to find a relationship between age and number of accidents. The data obtained are given in the following table:
|
No. of accidents (in one year) |
|||||
|
Age of drivers (in years) |
0 |
1 |
2 |
3 |
More than 3 |
|
18–25 |
320 |
125 |
75 |
45 |
30 |
|
25-40 |
400 |
45 |
50 |
15 |
10 |
|
40-55 |
150 |
85 |
13 |
8 |
10 |
|
Above 55 |
150 |
25 |
17 |
20 |
7 |
Find the number of drivers
(a) in the age of 25–40 years and has more than 2 accidents in the year.
(b) the age is above 40 years and has accidents more than 1 but less than 3.
(a) The number of drivers in the age of 25-40 years and has more than 2 accidents in the year = 15+10 = 25
(b) The number of drivers the age of whose is 40 years and has accidents more than 1 but less than 3 = 13 + 17 = 30.
On a busy road, following data was observed about cars passing through it and number of occupants
|
No. of occupants |
No. of cars |
|
1 |
29 |
|
2 |
26 |
|
3 |
23 |
|
4 |
17 |
|
5 |
5 |
Suppose another car passes by. Find the chance that it has
(i) exactly 5 occupants
(ii) more than 2 occupants (iii) less than 5 occupants.
otal number of cars = 29 + 26 + 23 + 17 + 5= 100
(i) Number of cars having exactly 5 occupants = 5
∴ Probability that it has exactly 5 occupants = 
(ii) Number of cars having more than 2 occupants = 23 + 17 + 5 = 45
∴ Probability that it has more than 2 occupants 
(iii) Number of cars having less than 5 occupants = 29 + 26 + 23 + 17 = 95
∴ Probability that it has less than 5 occupants 
The king, queen and jack of clubs are removed from a deck of 52 cards and then well shuffled. One card is selected at random from the remaining cards. Find the probability of getting
(a) a heart
(b) a king
(c) the 10 of hearts.
Total number of cards in the deck when king, queen and jack of clubs are removed = 52–3 = 49 (a) Number of cards which are ‘a heart’ = 13 Probablity of getting a heart =
(b) Number of cards which are ‘a king’ = 3 Probablity of getting a king =
(c) Number of cards which are ‘the 10 of heart’ = 1 Probablity of getting the 10 of heart's =
A coin is tossed 1000 times with the following frequencies:
Head: 455, Tail: 545
Compute the probability for each event.
Solution not provided.
Ans. 0.455,0.545
Two coins are tossed simultaneously 500 times, and we get
Two heads: 105 times
One head: 275 times
No head: 120 times
Find the probability of occurrence of each of these events.
Solution not provided.
Ans. 0.21, 0.55, 0.24
A dice is thrown 1000 times with the following frequencies for the outcomes 1, 2, 3, 4, 5 and 6 given in the following table:
Table
|
Outcome |
1 |
2 |
3 |
4 |
5 |
6 |
|
Frequency |
179 |
150 |
157 |
149 |
175 |
190 |
Find the probability of the happening of each outcome.
Solution not provided.
Ans. 0.179,0.15,0.157,0.149, 0.175, 0.19
On one page of a telephone directory, there were 200 telephone numbers. The frequency distribution of their unit place digit (for example, in the number 25828573, the unit place digit is 3) is given in the table below:
Table
|
Digit |
0 |
1 |
2 |
3 |
4 |
5 |
6 |
7 |
8 |
9 |
|
|
Frequency |
22 |
26 |
22 |
22 |
20 |
10 |
14 |
28 |
16 |
20 |
|
Without looking at the page, the pencil is placed on one of these numbers, i.e., the number is chosen at random. What is the probability that the digit in its unit place is 6?
Solution not provided.
Ans. 0.07
The record of a weather station shows that out of the past 250 consecutive days, its weather forecasts were correct 175 times:
(i) What is the probability that on a given day it was correct?
(ii) What is the probability that it was not correct on a given day?
Solution not provided.
Ans. 0 0.7 (ii) 0.3
A tyre manufacturing company kept a record of the distance covered before a tyre needed to be replaced. The table shows the results of 1000 cases. [CBSE 2012 (March)]
Table
|
Distance (in km) |
less than 400 |
400 to 900 |
900 to 1400 |
more than 1400 |
|
Frequency |
210 |
325 |
385 |
80 |
If you buy a tyre of this company, what is the probability that:
(i) it will need to be replaced before it has covered 400 km?
(ii) it will last more than 900 km?
(iii) it will need to be replaced after it has covered somewhere between 400 km andb 1400 km?
(iv) it will not need to be replaced at all?
(v) it will need to be replaced?
Solution not provided.
Ans. (00.21 (ii) 0.465 (iii) 0.71 (iv) 0 (v) 1
The percentage of marks obtained by a student in the monthly unit tests are given below:
Table
|
Unit test |
I |
II |
III |
IV |
V |
|
Percentage of marks obtained |
69 |
71 |
73 |
68 |
74 |
Based on this data, find the probability that the student gets more than 70% marks in a unit test.
Solution not provided.
Ans. 0.6
An insurance company selected 2000 drivers at random (i.e., without any preference of one driver over another) in a particular city to find a relationship between age and accidents. The data obtained are given in the following table:
Table
|
Age of drivers |
Accidents in one year |
||||
|
(in years) |
0 |
1 |
2 |
3 |
over 3 |
|
18–29 |
440 |
160 |
110 |
61 |
35 |
|
30-50 |
505 |
125 |
60 |
22 |
18 |
|
Above 50 |
360 |
45 |
35 |
15 |
9 |
Find the probabilities of the following events for a driver chosen at random from the city:
(i) being 18–29 years of age and having exactly 3 accidents in one year.
(ii) being 30-50 years of age and having one or more accidents in a year.
(iii) having no accidents in one year.
Solution not provided.
Ans. (i) 0.0305 = 0.031 (ii) 0.1125 = 0.113 (iii) 0.653
Consider the following frequency distribution table, which gives the weights of 38 students of a class:
(i) Find the probability that the weight of a student in the class lies in the interval 46-50 kg.
(ii) Give two events in this context, one having probability 0 and the other having probability 1:
Table
|
Weights (in kg) |
Number of students |
|
31-35 |
9 |
|
36-40 |
5 |
|
41–45 |
14 |
|
46-50 |
3 |
|
51-55 |
1 |
|
56-60 |
2 |
|
61-65 |
2 |
|
66-70 |
1 |
|
71–75 |
1 |
|
Total |
38 |
Solution not provided.
Ans. (i) 0.079
(ii) The event that the weight of a student is above 30 kg has probability 1. The event that the weight of a student is below 30 kg has probability 0.
Fifty seeds were selected at random from each of 5 bags of seeds, and were kept under standardised conditions favourable to germination. After 20 days the number of seeds which had germinated in each collection were counted and recorded as follows:
Table
|
Bag |
1 |
2 |
3 |
4 |
5 |
|
Number of seeds germinated |
40 |
48 |
42 |
39 |
41 |
What is the probability of germination of
(i) more than 40 seeds in a bag?
(ii) 49 seeds in a bag?
(iii) more than 35 seeds in a bag?
Solution not provided.
Ans. (00.6 (ii) 0 (iii) 1.
Two coins are tossed simultaneously 1000 times with the following frequencies of different outcomes.
|
Outcome |
Frequency |
|
2 heads |
350 |
|
1 head |
310 |
|
No head |
340 |
If these two coins are tossed again, find the probability of getting
(i) at least 1 head
(ii) at most 1 head
Solution not provided.
Ans. 
Two coins are tossed simultaneously 500 times,
and we get
|
Result |
2 head |
1 head |
No head |
|
Frequency |
105 |
275 |
120 |
Find the probability of occurrence of
(i) two heads
(ii) all tails.
Solution not provided.
Ans. 
Sponsor Area
These coins are tossed simultaneously 200 times with the following frequencies of different outcomes:
|
Outcome |
Frequency |
|
3 heads |
24 |
|
2 heads |
70 |
|
1 head |
75 |
|
3 tails |
31 |
Compute the probability of getting
(i) less than 2 heads
(ii) 3 heads.
Solution not provided.
Ans. 
A bag has 3 red and 7 black balls. One ball is taken out of the bag. Find the probability that it is a
(i) red ball
(ii) black ball.
Solution not provided.
Ans. 
1000 families with 2 children mere selected randomly, and the following data were recorded:
|
No. of girls in the family |
No. of families |
|
2 |
500 |
|
1 |
270 |
|
0 |
230 |
Compute the probability of a family, chosen at random having (0 2 girls
(ii) 1 girl
(iii) No girl
Solution not provided.
Ans.
Three coins are tossed simultaneously 250 times with the following frequencies of different outcomes:
|
Outcome |
Frequency |
|
3 heads |
38 |
|
2 heads |
82 |
|
1 head |
87 |
|
No head |
43 |
If the three coins are simultaneously tossed again, find the probability of
(i) 3 heads
(ii) less than 2 heads
(iii) 2 heads
Solution not provided.
Ans. 
Solution not provided.
Ans. 
The following table represents the weight of 50 students of a school. A student is selected at random from the school. Find the probability of a student having weight of less than 60 kg.
|
Weight (in kg) |
Number of students |
|
50-55 |
8 |
|
55–60 |
27 |
|
60-65 |
12 |
|
65-70 |
3 |
Solution not provided.
Ans. 
Given below is the frequency distribution of salary (in र) of 100 workers in a factory:
|
Salary (in र) |
Number of workers |
|
1000–2000 |
10 |
|
2000–3000 |
30 |
|
3000-4000 |
20 |
|
4000-5000 |
40 |
Answer the following questions. How many workers
(i) have salary below र3000?
(ii) have salary between र3000 and र5000?
(iii) from र1000 to र5000?
Solution not provided.
Ans. 
In a survey of 500 families, number of vehicles owned per family were found to be as follows:
|
Number of vehicles named |
Number of families |
|
0 |
35 |
|
1 |
213 |
|
2 |
170 |
|
3 |
65 |
|
4 |
17 |
Find the probability that a family selected at random has
(i) no vehicles
(ii) 2 or 3 vehicles
(iii) more than 1 vehicle.
Solution not provided.
Ans. 
Solution not provided.
Ans. 
A die is thrown 1000 times with the following frequencies for the outcomes 1,2,3,4,5 and 6 as given below:
|
Outcome |
Frequency |
|
1 |
175 |
|
2 |
125 |
|
3 |
250 |
|
4 |
150 |
|
5 |
100 |
|
6 |
200 |
If the same die is thrown once more, find the probability of outcome 2, 4 and 6.
Solution not provided.
Ans. 
The ages of workers in a factory are given in the following table:
|
Age (in years) |
Number of workers |
|
21-23 |
3 |
|
23-25 |
4 |
|
25-27 |
5 |
|
27-29 |
6 |
|
29–31 |
5 |
|
31-33 |
4 |
|
33-35 |
3 |
Find the probability that the age of worker selected at random is at least 25 years.
Solution not provided.
Ans. 
A dice is thrown 100 times with the frequencies for the outcomes 1, 2, 3, 4, 5 and 6 as given in the following table:
|
Outcome |
Frequency |
|
1 |
10 |
|
2 |
20 |
|
3 |
10 |
|
4 |
20 |
|
5 |
25 |
|
6 |
15 |
Find the probability of outcome 1


A.
Three coins one tossed simultaneously 600 times with the following frequencies of different outcomes:
|
Outcome |
Frequency |
|
3 heads |
150 |
|
2 heads |
200 |
|
1 head |
100 |
|
no head |
150 |
The probability of getting 3 heads is


C.
The following table shows the birth day of 30 students of class X:
|
Day |
Number of students |
|
Sunday |
3 |
|
Monday |
6 |
|
Tuesday |
2 |
|
Wednesday |
1 |
|
Thursday |
9 |
|
Friday |
5 |
|
Saturday |
4 |
Find the probability that a student was bom on Saturday.


A.
The following table gives the distribution of IQ (intelligence quotient) of 60 pupils of class IX in a school:
|
IQ |
No. of pupils |
|
60–70 |
2 |
|
70–80 |
3 |
|
80-90 |
5 |
|
90-100 |
16 |
|
100–110 |
14 |
|
110-120 |
13 |
|
120-130 |
7 |
Find the probability that a student of class IX selected at random has IQ in the interval 80-90.


A.
The following table depicts the scores of 200 students in a test:
|
Scores |
Number of students |
|
400-450 |
15 |
|
450-500 |
30 |
|
500-550 |
35 |
|
550-600 |
30 |
|
600-650 |
25 |
|
650-700 |
25 |
|
700-750 |
20 |
|
750-800 |
20 |
Find the probability that a student selected at random has his score in the interval 650-700.


C.
Following are the marks of a group of 100 students in a test of reading ability:
|
Marks |
Number of students |
|
50–52 |
5 |
|
47-49 |
12 |
|
44–46 |
16 |
|
41-43 |
19 |
|
38-40 |
20 |
|
35-37 |
15 |
|
32-34 |
15 |
Find the probability that a student selected at random gets marks in the interval 38–40.


D.
The following distribution gives the times taken by 25 students to solve a problem:
|
Time (in seconds) |
Number of students |
|
15-20 |
2 |
|
20-25 |
3 |
|
25-30 |
7 |
|
30-35 |
6 |
|
35–40 |
4 |
|
40-45 |
2 |
|
45-50 |
1 |
Find the probability that the time taken by a student to solve the problem lies in the interval 35–40 or 45–50.


D.
The following table presents the number of literate females in a town:
|
Age group |
Number offemales |
|
10-15 |
300 |
|
15-20 |
980 |
|
20-25 |
800 |
|
25-30 |
580 |
|
30-35 |
290 |
|
35-40 |
50 |
Find the probability that a literate female in from age group 10–15.


B.
The distribution of weights (in kg) of 100 people is given below:
|
Weight (in kg) |
Frequency |
|
40-45 |
13 |
|
45-50 |
25 |
|
50–55 |
28 |
|
55-60 |
15 |
|
60-65 |
12 |
|
65-70 |
5 |
|
70-75 |
2 |
Find the probability that the weight of a people selected at random is in the class 45-50.


C.
Sponsor Area
D.
0 ≤ P(E) ≤ 1Marks obtained by 500 students in a test of 100 marks are tabulated as below:
|
Marks obtained |
No. of students |
|
0–25 |
58 |
|
25-50 |
122 |
|
50-75 |
165 |
|
75-100 |
155 |
If a student is selected at random, the probability that he obtains less than 50% marks is:


B.
In a blood test the following blood groups were recorded:
|
Blood group |
No. of students |
|
A |
10 |
|
AB |
15 |
|
B |
11 |
|
O |
3 |
A student is selected at random from the class. The probability that student has blood grou ‘AB’ is:


A.
In a medical examination of students of a class, the following blood groups are recorded:
|
Blood group |
No. of students |
|
A |
10 |
|
AB |
13 |
|
B |
12 |
|
O |
5 |
A student is selected at random from the class. The probability that a student has blood group ‘B’ is:


C.
The percentage of marks obtained by a student in mathematics in five monthly unit tests are given below:
|
Unit Test |
I |
II |
III |
IV |
V |
|
Percentage of marks obtained |
69 |
71 |
73 |
68 |
74 |
Probability that the student gets more than 70% marks in the next unit test is:
0


C.
Sponsor Area
A die is thrown 400 times and outcomes are recorded as follows:
|
Outcome |
Frequency |
|
1 |
70 |
|
2 |
65 |
|
3 |
60 |
|
4 |
75 |
|
5 |
63 |
|
6 |
67 |
Find the probability of getting an add number.
Solution not provided.
Ans.
Three coins are tossed simultaneously 250 times. The distribution of various outcomes is listed below:
(i) Three tails : 30
(ii) Both tails : 70
(iii) One tail: 90
(iv) No tails : 60
Find the respective probability of each event and check that the sum of all the probabalities is
Solution not provided.
Ans. 
The weekly pocket expenses of students are given below. Find the probability that the weekly pocket expenses of a student are:
(i) र 59
(ii) more than र 59
(iii) less than र 59
|
Pocket expenses (in र) |
No. of students |
|
45 |
7 |
|
40 |
4 |
|
59 |
10 |
|
71 |
6 |
|
58 |
3 |
|
63 |
8 |
|
65 |
1 |
Solution not provided.
Ans. 
The percentage of marks obtained by a student in the monthly unit tests are given below:
|
Unit test |
No. of marks obtained |
|
I |
76 |
|
II |
52 |
|
III |
60 |
|
IV |
95 |
|
V |
43 |
Based on this data, find the probability that the
(a) student gets less than 60% marks in a unit test
(b) student gets at least 60% marks in a unit test
Solution not provided.
Ans. 
The weights of 60 persons in a group are given below:
|
Weight (in kg) |
No. of persons |
|
60 |
5 |
|
61 |
18 |
|
62 |
4 |
|
63 |
16 |
|
64 |
5 |
|
65 |
12 |
Find the probability that a person selected at random has
(a) weight less than 70 kg
(b) weight between 61 and 64 kgs
(c) weight equal to more than 64 kg
Solution not provided.
Ans. (a) 1 (b)  (c)
(c) 
Over the past 200 working days, the number of defective parts produced by a machine are given in the following table:
|
No. of defective parts |
Day |
|
0 |
50 |
|
1 |
32 |
|
2 |
22 |
|
3 |
18 |
|
4 |
12 |
|
5 |
12 |
|
6 |
10 |
|
7 |
10 |
|
8 |
10 |
|
9 |
8 |
|
10 |
6 |
|
11 |
6 |
|
12 |
6 |
|
13 |
6 |
Determine the probability that tomorrow’s output will have not more than 5 defective parts.
Solution not provided.
Ans. 
In a mathematics test, 90 students obtained (out of 100) the marks given in the following table:
|
Marks |
No. of students |
|
1-20 |
8 |
|
21-40 |
12 |
|
41-50 |
15 |
|
51-60 |
20 |
|
61-70 |
13 |
|
71-80 |
17 |
|
81-90 |
05 |
Find the probability:
(i) a student obtained less than 41,
(ii) a student obtained more than 50,
(iii) a student obtained between 41 and 80.
Solution not provided.
Ans. 
The data regarding the number of children in a house of a colony which has 250 houses was collected and is recorded below. The houses with number of children are recorded below:
|
No. of children |
No. of houses |
|
1 child |
48 |
|
2 boys |
72 |
|
2 girls |
63 |
|
1 boy and 1 girl |
55 |
|
No child |
10 |
One house is selected at random. What is the probability that it is a house which has
(a) 2 boys?
(b) more than one child?
(c) no children at all?
Solution not provided.
Ans. 
Sponsor Area
Sponsor Area


 then x = .....