☰
Data Handling
(i) What is the information given by the double bar graph?
(ii) In which subject has the performance improved the most?
(iii) In which subject the performance deteriorated?
(iv) In which subject is the performance at par?
Detailed solution not provided.
Ans. (i) Marks obtained by a student in different subjects by a student in 2005-06 and 2006-07.
(ii) Mathematics
(iii) English
(iv) Hindi


Sponsor Area
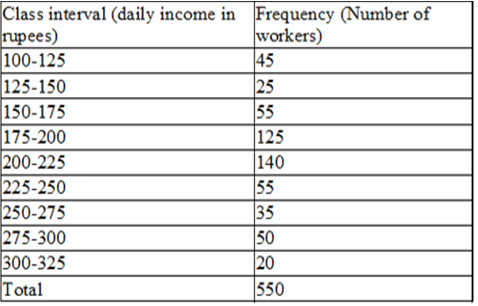
(i) What is the size of the class intervals?
(ii) Which class has the highest frequency?
(iii) Which class has the lowest frequency?
(iv) What is the upper limit of the class interval 250-275?
(v) Which two classes have the same frequency?
|
40, |
38, |
33, |
48, |
60, |
53, |
31, |
|
46, |
34, |
36, |
49, |
41, |
55, |
49, |
|
65, |
42, |
44, |
47, |
38, |
39 |
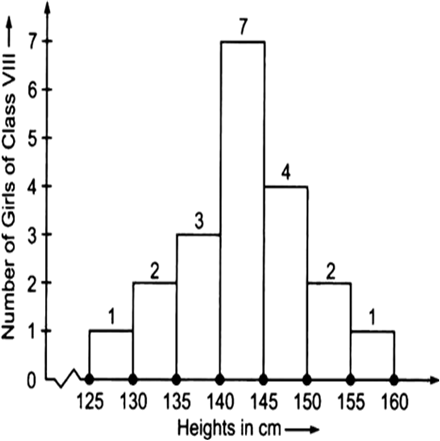
(i) What information is being given by the histogram?
(ii) Which group contains maximum girls?
(iii) How many girls have a height of 145 cm and more?
(iv) If we divide the girls into the following three categories, how many would there be in each?
150 cm and more -Group A
140 cm to less than 150 cm -Group B
Less than 140 cm -Group C
For which of these would you use a histogram to show the data?
(a) The number of letters for different areas in a postman’ bag.
(b) The height of competitors in an athletics meet.
(c) The number of cassettes produced by 5 companies.
(d) The number of passengers boarding trains from 7:00 a.m. to 7:00 p.m. at a station.
Give reasons for each.
The weekly wages (in Rs) of 30 workers in a factory are:
830, 835, 890, 810, 835, 836, 869, 845, 898, 890, 820, 860, 832, 833, 855, 845, 804, 808, 812, 840, 885, 835, 835, 836, 878, 840, 868, 890, 806, 840
Using tally marks make a frequency table with intervals as 800–810, 810-820 and so on.
Sponsor Area
Sponsor Area