Question
Draw an appropriate graph to represent the given information.

Solution
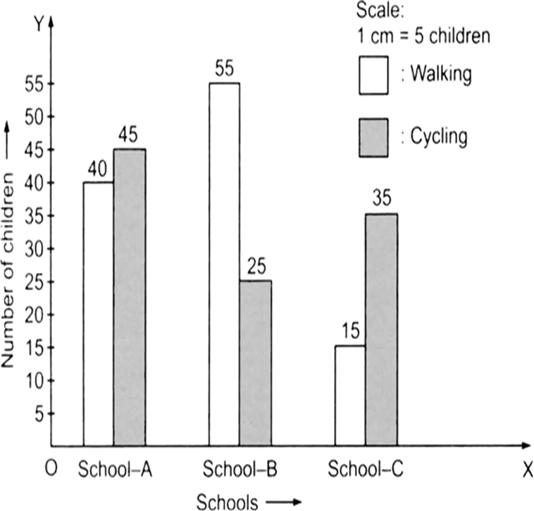
Since, a comparison of two activities (walking and cycling) is to be represented, therefore a double-graph is drawn by taking the schools along x-axis and number of children along y-axis, using a scale of 1 cm = 5 children.