Question
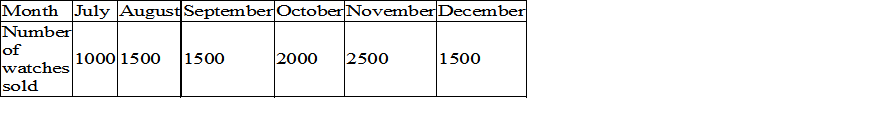
Draw an appropriate graph to represent the given information.
Solution
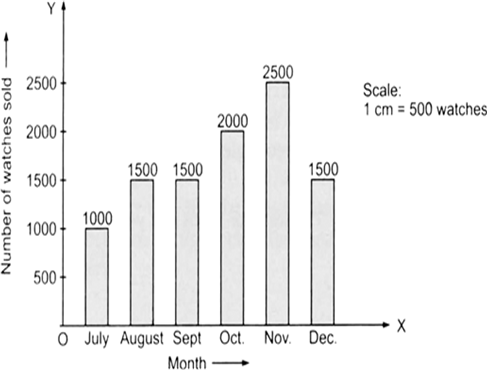
To represent the given data by a bar-graph, draw two axes perpendicular to each other. Now, represent ‘Months’ on OX and ‘Number of watch sold’ on OY. Erect rectangles of the same width. The heights of the rectangles are proportional to number of watches, using a suitable scale:
Here, scale is 1 cm = 500 watches
Since 500 watches = 1 cm
1000 watches = 2 cm
1500 watches = 3 cm
2000 watches = 4 cm
2500 watches = 5 cm