Sponsor Area

Data Handling

Question
CBSEENMA8003223

A group of students was asked for their favorite subject. The results were listed as under:

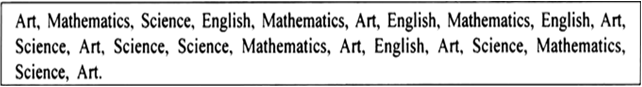
Answer the following questions:
(i) Which is the most liked subject?
(ii) Which is the least liked subject?

Solution

Detailed solution not provided.
Ans.   (i) Science
           (ii) English
         

Some More Questions From Data Handling Chapter

Draw an appropriate graph to represent the given information.


Draw an appropriate graph to represent the given information.
Percentage wins in ODI by 8 top cricket teams.


A group of students were asked to say which animal they would like most to have as a pet. The results are given below:
dog, cat, cat, fish, cat, rabbit, dog, cat, rabbit, dog, cat, dog, dog, dog, cat, cow, fish, rabbit, dog, cat, dog, cat, cat, dog, rabbit, cat, fish, dog.
Make a frequency distribution table for the same.

Study the following frequency distribution table and answer the questions given below.
Frequency distribution of daily income of 550 workers of a factory

(i) What is the size of the class intervals?
(ii) Which class has the highest frequency?
(iii) Which class has the lowest frequency?
(iv) What is the upper limit of the class interval 250-275?
(v) Which two classes have the same frequency?


Construct a frequency distribution table for the data on weights (in kg) of 20 students of a class using intervals 30–35, 35–40 and so on.

40,

38,

33,

48,

60,

53,

31,

46,

34,

36,

49,

41,

55,

49,

65,

42,

44,

47,

38,

39

Observe the histogram figure and answer the questions given below:


(i) What information is being given by the histogram?
(ii) Which group contains maximum girls?
(iii) How many girls have a height of 145 cm and more?
(iv) If we divide the girls into the following three categories, how many would there be in each?
150 cm and more                                                         -Group A
140 cm to less than 150 cm                                         -Group B
Less than 140 cm                                                         -Group C


For which of these would you use a histogram to show the data?
(a) The number of letters for different areas in a postman’ bag.
(b) The height of competitors in an athletics meet.
(c) The number of cassettes produced by 5 companies.
(d) The number of passengers boarding trains from 7:00 a.m. to 7:00 p.m. at a station.
Give reasons for each.

The shoppers who come to a departmental store are marked as: man (M), woman (W), boy (B) or girl (G). The following list gives the shoppers who came during the first hour in the morning:
W W W G B W W M G G M M W W W W G B M W B G G M W W M M W W
W M W B W G M W W W W G W M M W W M W G W M G W M M B G G
Make a frequency distribution table using tally marks. Draw a bar graph to illustrate it.

The weekly wages (in Rs) of 30 workers in a factory are:
830, 835, 890, 810, 835, 836, 869, 845, 898, 890, 820, 860, 832, 833, 855, 845, 804, 808, 812, 840, 885, 835, 835, 836, 878, 840, 868, 890, 806, 840
Using tally marks make a frequency table with intervals as 800–810, 810-820 and so on.

Draw a histogram for the frequency table made for the data in Question 3, and answer the following questions.
(i) Which group has the maximum number of workers?
(ii) How many workers earn Rs 850 and more?
(iii) How many workers earn less than Rs 850?