Question
Draw an appropriate graph to represent the given information.
Percentage wins in ODI by 8 top cricket teams.
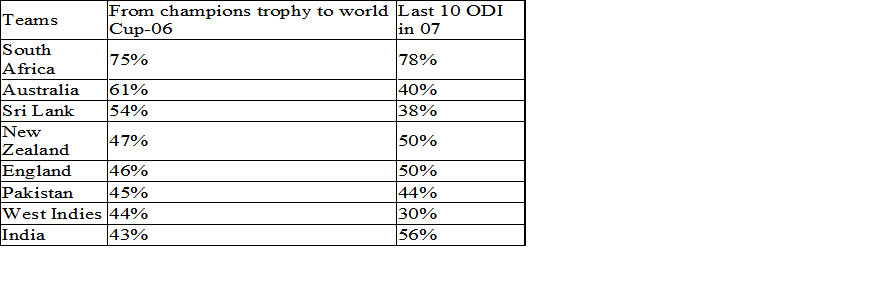
Solution
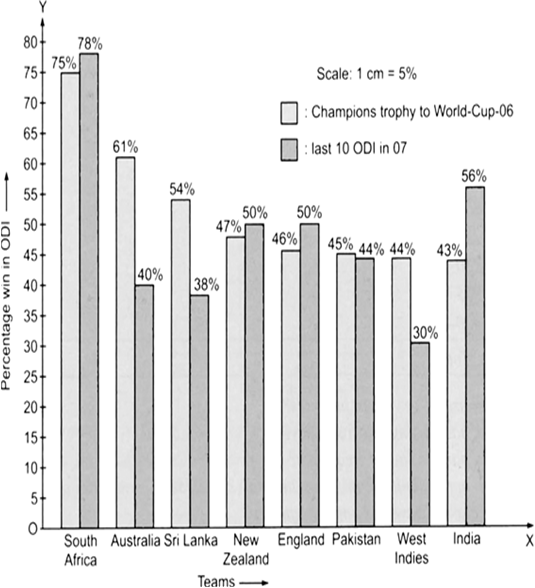
To compare the percentage win in ODI achieved by various teams, we represent the data by a double-bar graph. We represent the teams along the x-axis and their ‘percentage win’ along y-axis, using the scale 1 cm = 5%.