☰
Data Handling
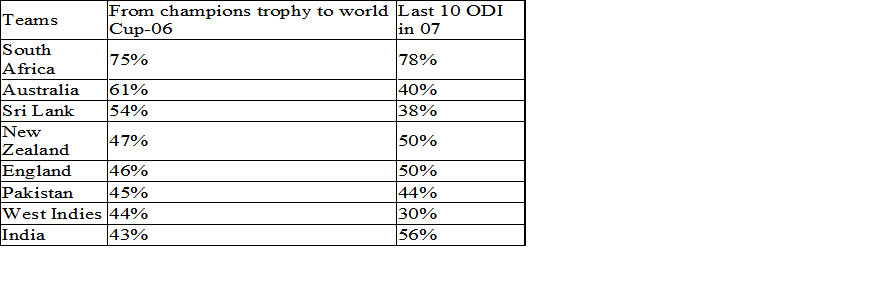
Since, a comparison of two activities (walking and cycling) is to be represented, therefore a double-graph is drawn by taking the schools along x-axis and number of children along y-axis, using a scale of 1 cm = 5 children.


Sponsor Area
Following are the marks scored by 30 students in a test out of 40 marks. Using tally marks prepare a frequency table:
|
30 |
18 |
27 |
15 |
25 |
28 |
15 |
30 |
|
35 |
36 |
25 |
30 |
20 |
28 |
17 |
30 |
|
36 |
35 |
35 |
18 |
30 |
17 |
30 |
|
|
25 |
36 |
28 |
25 |
25 |
18 |
16 |
|
30 |
39 |
58 |
17 |
34 |
50 |
23 |
37 |
|
42 |
49 |
55 |
59 |
19 |
28 |
47 |
49 |
|
18 |
60 |
56 |
36 |
58 |
35 |
55 |
37 |
|
25 |
34 |
39 |
61 |
53 |
33 |
36 |
53 |
|
61 |
62 |
39 |
53 |
21 |
18 |
28 |
23 |


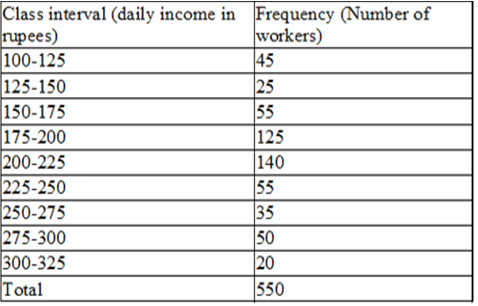
(i) What is the size of the class intervals?
(ii) Which class has the highest frequency?
(iii) Which class has the lowest frequency?
(iv) What is the upper limit of the class interval 250-275?
(v) Which two classes have the same frequency?
|
40, |
38, |
33, |
48, |
60, |
53, |
31, |
|
46, |
34, |
36, |
49, |
41, |
55, |
49, |
|
65, |
42, |
44, |
47, |
38, |
39 |
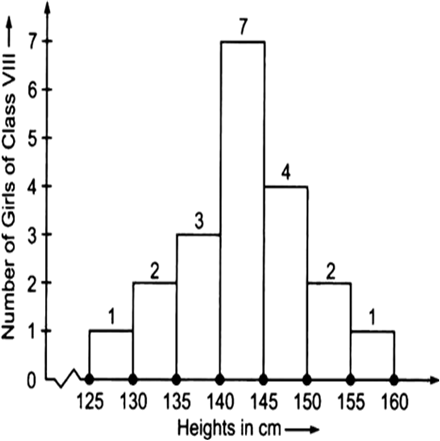
(i) What information is being given by the histogram?
(ii) Which group contains maximum girls?
(iii) How many girls have a height of 145 cm and more?
(iv) If we divide the girls into the following three categories, how many would there be in each?
150 cm and more -Group A
140 cm to less than 150 cm -Group B
Less than 140 cm -Group C
For which of these would you use a histogram to show the data?
(a) The number of letters for different areas in a postman’ bag.
(b) The height of competitors in an athletics meet.
(c) The number of cassettes produced by 5 companies.
(d) The number of passengers boarding trains from 7:00 a.m. to 7:00 p.m. at a station.
Give reasons for each.
Sponsor Area
Sponsor Area