Question
The graph shows the temperature of a patient recorded before noon. Read it and answer the following questions.
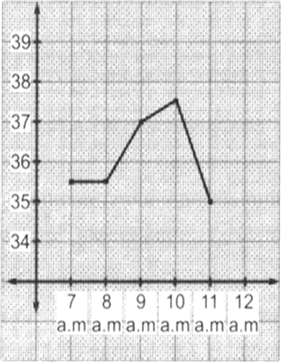
(i) What was patient’s temperature at 9 a.m.?
(ii) What the highest temperature of the patient?
(iii) When was the patient’s temperature lowest?
(iv) During which period, the patient's temperature remained constant?
Solution
Solution not provided.
Ans. 

(iiii) 11 a.m.
(iv) 7 a.m. to 8 a.m.