Question
Draw the graphs for the following tables of values, with suitable scales on the axes,
Interest on deposits for a year.
 (i) Does the graph pass through the origin?
(ii) Use the graph to find the interest on Rs 2500 for a year.
(iii) To get an interest of Rs 280 per year, how much money should be deposited?
Solution
Steps:
I. Draw axes.
II. Take appropriate scale on x-axis and y-axis.
III. Mark the deposits along the x-axis.
IV. Mark the interest along the y-axis.
V. Plot the point (1000, 80) (2000, 160), (3000, 240), (4000, 320) and (5000, 400).
VI. Join the points and get the graph.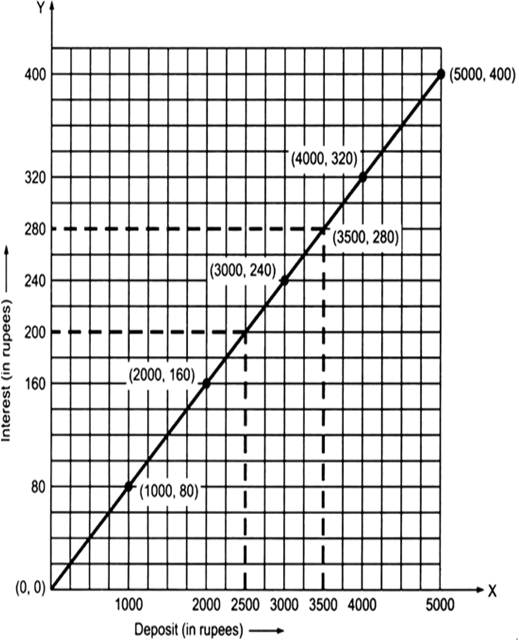
Now from the graph, we have:
(i) Yes, it passes through the origin.
(ii) From the graph, the interest on Rs 2500 is Rs 200.
(iii) From the graph an interest of Rs 280 can be got by depositing Rs 3500.