Sponsor Area
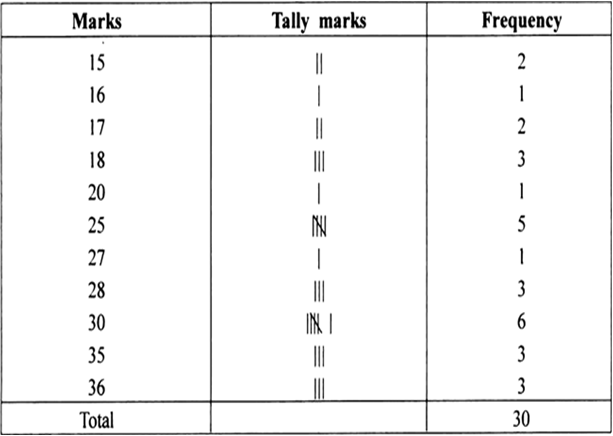
Following are the marks scored by 30 students in a test out of 40 marks. Using tally marks prepare a frequency table:
30 |
18 |
27 |
15 |
25 |
28 |
15 |
30 |
35 |
36 |
25 |
30 |
20 |
28 |
17 |
30 |
36 |
35 |
35 |
18 |
30 |
17 |
30 |
|
25 |
36 |
28 |
25 |
25 |
18 |
16 |
30 |
39 |
58 |
17 |
34 |
50 |
23 |
37 |
42 |
49 |
55 |
59 |
19 |
28 |
47 |
49 |
18 |
60 |
56 |
36 |
58 |
35 |
55 |
37 |
25 |
34 |
39 |
61 |
53 |
33 |
36 |
53 |
61 |
62 |
39 |
53 |
21 |
18 |
28 |
23 |
The highest observation = 61.
The lowest observation = 17.
One of the class intervals = 40–48.
Class size = Upper class limit - Lower class limit = 48 – 40 = 8
∴ The appropriate classes can be:
16–24, 24–32, 32–40, 40–48, 48–56, 56–64
Thus, the frequency distribution table for the above data can be:
To represent the given data by a bar-graph, draw two axes perpendicular to each other. Now, represent ‘Months’ on OX and ‘Number of watch sold’ on OY. Erect rectangles of the same width. The heights of the rectangles are proportional to number of watches, using a suitable scale:
Here, scale is 1 cm = 500 watches
Since 500 watches = 1 cm
1000 watches = 2 cm
1500 watches = 3 cm
2000 watches = 4 cm
2500 watches = 5 cm
(i) What is the size of the class intervals?
(ii) Which class has the highest frequency?
(iii) Which class has the lowest frequency?
(iv) What is the upper limit of the class interval 250-275?
(v) Which two classes have the same frequency?
(i) Class size = [Upper class limit] - [Lower class limit] = 125 - 100 = 25.
(ii) The class 200-225 is having the highest frequency (which is 140).
(iii) The class 300-325 is having the lowest frequency (which is 20).
(iv) The upper limit of the class interval 250-275 is 275.
(v) The classes (150–175) and (225-250) are having the same frequency (which is 55).
40, |
38, |
33, |
48, |
60, |
53, |
31, |
46, |
34, |
36, |
49, |
41, |
55, |
49, |
65, |
42, |
44, |
47, |
38, |
39 |
Lowest observation = 31
Highest observation = 65
Class intervals: 30–35, 35–10, 40–45, ... .
The frequency distribution table for the above data can be:
(i) What information is being given by the histogram?
(ii) Which group contains maximum girls?
(iii) How many girls have a height of 145 cm and more?
(iv) If we divide the girls into the following three categories, how many would there be in each?
150 cm and more -Group A
140 cm to less than 150 cm -Group B
Less than 140 cm -Group C
(i) The above histogram represents the heights (in cms) of girls of Class VIII.
(ii) The group 140–145 contains maximum number of girls (which has as much as 7 girls).
(iii) 1 girls (= 4 + 2 + 1) have a height of 145 cm and more.
(iv) Number of girls in
Group A: 150 cm and more = 2+1=3 girls
Group B: 140 cm to less than 150 cm = 7 + 4 = 11 girls
Group C: Less than 140 cm = 1 + 2 + 3 = 6 girls
Note: The broken line is used along the horizontal line to indicate that we are not showing the numbers between 0 and 125.
For which of these would you use a histogram to show the data?
(a) The number of letters for different areas in a postman’ bag.
(b) The height of competitors in an athletics meet.
(c) The number of cassettes produced by 5 companies.
(d) The number of passengers boarding trains from 7:00 a.m. to 7:00 p.m. at a station.
Give reasons for each.
The weekly wages (in Rs) of 30 workers in a factory are:
830, 835, 890, 810, 835, 836, 869, 845, 898, 890, 820, 860, 832, 833, 855, 845, 804, 808, 812, 840, 885, 835, 835, 836, 878, 840, 868, 890, 806, 840
Using tally marks make a frequency table with intervals as 800–810, 810-820 and so on.
The lowest observation = 804
The highest observation = 892
The classes are: 800–810, 810–820, etc.
The frequency distribution table is:
Now, we can answer the question,
(i) The group 830-840 has the maximum number of workers.
(ii) Number of workers earning Rs 850 or more =1+3 + 1 + 1+ 4=10
(iii) Number of workers earning less than Rs 850 = 3 + 2+1+9 + 5 = 20
(i) Number of hours for which maximum number of students watch TV = 4 to 5 hours
(ii) Number of students watching TV for less than 4 hours = 4 + 8 + 22 = 34
(iii) Number of students watching TV for more than 5 hours = 8 + 6 = 14
(i) What is the information given by the bar graph?
(ii) In which year is the increase in the number of students is maximum?
(iii) In which year is the number of students maximum?
(iv) Is the number of students during 2005-06 twice that of 2003-04?
Detailed solution not provided.
Ans. (i) Number of students in Class VIII in different academic years.
(ii) 2004-05
(iii) 2007-08
(iv) No
(i) What is the information given by the double bar graph?
(ii) In which subject has the performance improved the most?
(iii) In which subject the performance deteriorated?
(iv) In which subject is the performance at par?
Detailed solution not provided.
Ans. (i) Marks obtained by a student in different subjects by a student in 2005-06 and 2006-07.
(ii) Mathematics
(iii) English
(iv) Hindi
Answer the following questions:
(i) Which is the most liked subject?
(ii) Which is the least liked subject?
Detailed solution not provided.
Ans. (i) Science
(ii) English
Sponsor Area
(i) How many teachers are of age 45 years or more but less than 50 years?
(ii) How many teachers are of age less than 35 years?
Detailed solution not provided.
Ans. (i) 5 teachers
(ii) 4+5+6 = 15 teachers.
(i) Find the fraction of the circle representing each of these given information.
(ii) What is the central angle corresponding to the activities “Play and Home work” ?
Each of the following pie charts gives you a different piece of information about your class. Find the fraction of the circle representing each of these information.
(i) Fraction of the circle representing the 'girls'
Fraction of the circle representing the 'boys'
(ii) Fraction of the circle representing 'walk'
Fraction of the circle representing 'bus or car'
Fraction of the circle representing 'cycle'
(iii) Fraction of the circle representing those who love mathematics
= (100 - 15)% =
Fraction of the circle representing those who hate mathematics = 15% =
Answer the following questions based on the pie chart given.
(i) Which type of programmes are viewed the most?
(ii) Which two types of programmes have number of viewers equal to those watching sports channels?
From the given pie chart, we have
Type of viewers |
Percentage |
Sports viewers |
25% |
News viewers |
15% |
Information- viewers |
10% |
Entertainment viewers |
50% |
obviously,
(i) The entertainment programmes are viewed the most.
(ii) The news and informative programmes have the equal number of viewers.
From this pie chart answer the following:
(i) If 20 people liked classical music, how many young people were surveyed?
(ii) Which type of music is liked by the maximum number of people?
(iii) If a cassette company were to make 1000 CD ’s how many of each type would they make?
(i) Let the requried number of young people = x
∴ 10% of x = 20
or
or
(ii) Maximum number of people like the light music.
(iii) Total number of CD's = 1000
∴ Number of CD's for semi classical = 20% of 1000
Number of CD's for classical = 10% of 1000
=
Number of CD's for folks =
Number of CD's for light music = 40% of 1000
(i) Which season got the most votes?
(ii) Find the central angle of each sector.
(iii) Draw a pie chart to show this information.
The adjoining pie chart gives the marks scored in an examination by a student in Hindi, English, Mathematics, Social Science and Science. If the total marks obtained by the student were 540, answer the following questions.
(i) In which subject did the student score 105 marks?
(Hint: for 540 marks, the central angle = 360°. So, for 105 marks, what is the central angle?
(ii) How many more marks were obtained by the student in Mathematics than in Hindi?
(iii) Examine whether the sum of the marks obtained in Social Science and Mathematics is more than that in Science and Hindi.
(Hint: Just study the central angles.)
(i) Total marks = 540
∴ Central angle corresponding to 540 marks =
Central angle corresponding to 105 marks =
Since the sector having central angle is is corresponding to Hindi.
Thus, the student obtained 105 marks in Hindi.
(ii) ∵ The central angle corresponding to the sector of Mathematics =
∴ Marks obtained in Mathematics =
Thus, marks more in Mathematics than in Hindi = 135 - 105 = 30
(iii) Since, the sum of the central angles for Social Science and Mathematics
=
Also, the sum of the central angles for Science and Hindi
=
∵ Marks obtained are proportional to the central angles corresponding to various items and
∴ Marks of in Science and Mathematics are more than the marks obtained in Science and Hindi.
Detailed solution not provided.
Ans. (i) Sleep
(ii) Play and others
(iii Sleep , school
, how work
; play
, others
Detailed solution not provided.
Ans. (i) 15-60 years
(ii) 30 thousand
(iii)
Detailed solution not provided.
Ans. (i) Transport
(ii) Education for children
(iii) Rs 2000
Sponsor Area
Suppose you spin the wheel
(i) List the number of outcomes of getting a green sector and not getting a green sector on this wheel.
(ii) Find the probability of getting a green sector.
(iii) Find the probability of not getting a green sector.
(i) Number of outcomes of getting a green sector = 5
Number of outcomes of not getting a green sector = 3
(ii) ∵ The total number of equality likely outcomes = 8
Number of outcomes of getting a green sector = 5
∴ Probability of getting a green sector =
(iii) Probability of getting a not-green sector =
On the spinning wheel there are 5 sectors containing A, B, C and D.
Since, there is only 1 sector containing D.
i.e. possible outcome = 1
Number of equally likely outcomes = 5
∴ Probability =
Number of possible outcomes = 52
Since, there are 4 aces in a pack of 52 cards, and out of them one ace can be obtained in 4 ways.
∴ Equally likely outcomes = 4
∴ Probability of getting an ace =
There are 7 apples in all
∴ Possible number of ways = 7
Since, there are 4 red apples: Therefore, a red apple can be obtained in 4 ways.
i.e. Equally likely outcome = 4
∴ Probability of getting a red apple =
Solution not provided.
Ans. A, B, C, D, E
Solution not provided.
Ans. (i) 4
(ii)
(i) The class interval
= [Upper limit of a class] - [Lower limit of the same class]
= 225 – 200
= 25
(ii) The class 300-325 is having the lowest frequency (which is 17).
(iii) The class 375-400 is having is the heighest frequency (which is 120).
(iv) The class intervals 275-300 and 350-375 have the same frequency (which is 45).
(v) The lower limit of the class interval 300-325 is 300.
(vi) The upper limit of the class interval 275-300 is 300.
(i) This histogram represents heights (in cms) of students of Class VIII.
(ii) The group (150–160) contains maximum number of students (which has 8 students).
(iii) 9 students (3 + 2 + 4) have height of 160 cm or more.
(iv) Number of students in the group of 130 - 140 cm = 3.
Number of students in the group of 160 – 170 cm =3
The required ratio = 3 : 3 = 1 : 1
Look at the adjoining circle graph and answer the following questions.
(i) What is the central angle corresponding to the activities "school and home work"?
(ii) Find the fraction of the circle representing each of these given information.
(i) Since, the total angle at the centre = 360°
i.e. The central angle corresponding to 24 hours = 360°
∴ Central angle form school =
=
Central angle for home work =
=
(ii) Fraction of the circle corresponding to:
Sleeping hours =
Schooling hours =
Playing hours =
Home-work hours =
Other activities hours =
The total sale = Rs 8000 + Rs 22000 + Rs 4000 + Rs 2000
= Rs 36, 000
The sales of various items are converted into central angles as given below:
Thus, the required pie chart is given below:
(i) Suppose the total number people surveyed = x
∴ 25% of x = 30
Thus, 120 people were surveyed
(ii) Minimum number of people like the semi classical music.
(iii) Maximum number of people like the light music
(iv) ∵ Total number of CD's = 1000
∴ Number of CD's for light music
= 45% of 1000 =
Number of CD's for folks
= 25% of 1000 =
Number of CD's for classical music
= 20% of 1000 =
Number of CD's for semi-classic music
= 10% of 1000 =
Centre angle of the sector representing
Hindi language =
English language =
Bengali language =
Marathi language =
Tamil language =
Now, the required pie chart is as given below:
Numbers 1 to 10 are written on ten separate cards such that one number on one slip. These are mixed well and one slip is chosen from the box without looking into it. What is the probability of:
(i) getting a card on which 7 is written?
(ii) getting a card having two-digit number on it?
(iii) getting a number less than 5?
(iv) getting a number more than 5?
Total number of outcomes = 10
(i) ∵ One card is having 7 on it.
∴ Number of favourable outcome = 1 Probability of getting a card having 7 on it =
(ii) ∵ Only one card is having two digit number (i.e. 10)
∴ Number of favourable outcome = 1 Probability of getting a card having 10 (two digit number) on it =
(iii) ∵ The numbers less than 5 are 1, 2, 3 and 4.
∴ Number of favourable outcomes = 4
Probability of getting a two-digit number =
or
(iv) ∵ The numbers more than 5 are 6, 7, 8, 9 and 10.
∴ Number of favourable outcomes = 5 Probability of getting a number more than 5 =
When a die is thrown, list the outcomes of an event of getting:
(i) A number less than 5.
(ii) A composite number.
(iii) A prime number.
(iv) A number more than 3.
Solution not provided.
Ans. 40
(i) What is the upper limit of 40–50?
(ii) What is the upper limit of 70–80?
(iii) What is the class size?
Solution not provided.
Ans. (i) 50
(ii) 80
(iii) 10
Solution not provided.
(i) In which subject did the student score 120 marks?
(ii) What is the difference in the marks obtained in Maths and English?
(iii) In which subject did he get minimum marks?
Solution not provided.
Ans. (i) English (ii) 15 (iii) Hindi
A die is thrown. What is the probability of getting:
(i) an even number?
(ii) an odd number?
(iii) A number between 3 and 6?
Solution not provided.
Ans. (i) (ii)
(iii)
Solution not provided.
Ans.
Sponsor Area
Solution not provided.
Ans.
B.
class mark?Sponsor Area
Sponsor Area