☰
Graphical Representation Of Data
Under given figure shows the number of commuters on foot on both sides of Yamuna Bridge in Delhi. Draw a flow map on the basis of this information.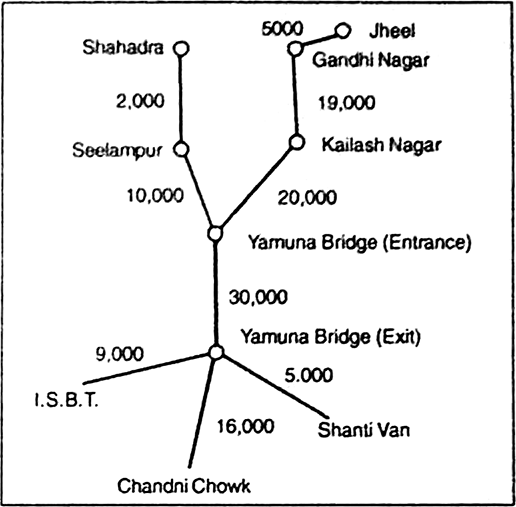
The minimum number of commuters is 2000 and maximum number is 30,000. Select a suitable scale and ribands showing the number of commuters on each road.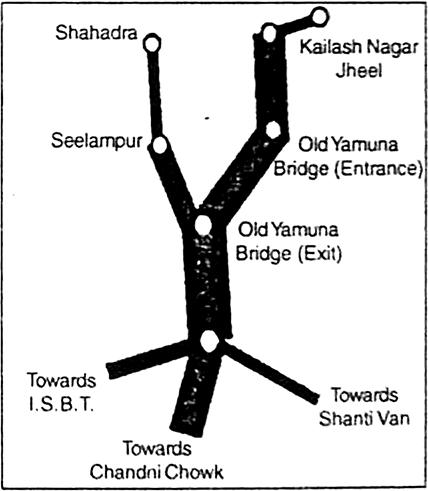
The thickness of the ribands should be in proportion to the number of commuters.


Sponsor Area
What is an isopleth map? How an interpolation is carried out?
Describe and illustrate important steps to be followed in preparing a choropleth map.
Discuss important steps to represent data with the help of pie-diagram.
Represent the following data with the help of suitable diagram:
|
Year |
1911 |
1921 |
1931 |
1941 |
1951 |
1961 |
1971 |
1981 |
1991 |
2001 |
|
Decimal Growth (%) |
0.35 |
8.27 |
19.12 |
31.97 |
41.42 |
26.41 |
38.23 |
46.14 |
36.47 |
31.13 |
Represent the following data with the help of suitable diagram:
India: Literacy and Enrolment Ratio in Primary and Upper Primary Schools
|
Year |
Literacy Ratio |
Enrolment |
Enrolment Ratio |
||||||
|
Ratio Primary |
Upper Primary |
||||||||
|
Person |
Male |
Female |
Boys |
Girls |
Total |
Boys |
Girls |
Total |
|
|
1950-51 |
18.3 |
27.2 |
8.86 |
60.6 |
25 |
42.6 |
20.6 |
4.6 |
12.7 |
|
1999-2000 |
65.4 |
75.8 |
54.2 |
104 |
85 |
94.9 |
67.2 |
50 |
58.8 |
Represent the following data with the help of a pie-diagram:
Land-use: 1983–84
|
1950-51 |
1998-2001 |
|
|
Net Sown Area |
42 |
46 |
|
Forest |
14 |
22 |
|
Not available for cultivation |
17 |
14 |
|
Fallow Land |
10 |
8 |
|
Pasture and Tree |
9 |
5 |
|
Culturable Waste Land |
8 |
5 |
Study the table given below and the given diagrams/maps.
Area and Production of Rice in major States
|
States |
Area in 000 ha |
% to Total Area |
Production in 000 tones |
% to Total Production |
|
West Bengal |
5,435 |
12.3 |
12,428 |
14.6 |
|
Uttar Pradesh |
5,839 |
13.2 |
11540 |
13.6 |
|
Andhra Pradesh |
4,028 |
9.1 |
12428 |
13.5 |
|
Punjab |
2,611 |
5.9 |
9154 |
10.8 |
|
Tamil Nadu |
2,113 |
4.8 |
7218 |
8.5 |
|
Bihar |
3,671 |
8.3 |
5417 |
6.4 |
(i) Construct a multiple bar diagram to show area under rice in each state.
(ii) Construct a pie diagram to show the percentange of area under rice in each state.
(iii) Construct a dot map to show the production of rice in each state.
(iv) Construct a choropleth map to show the percentage of production of rice in states.
Represent the following data by suitable. The rural and urban population of India diagram:
|
Year |
Rural |
Urban |
|
Polpulation (%) |
Population (%) |
|
|
1901 |
29.2 |
10.8 |
|
1911 |
89.7 |
10.3 |
|
1921 |
88.8 |
11.2 |
|
1931 |
88.0 |
12.0 |
|
1941 |
86.1 |
13.9 |
|
1951 |
82.7 |
17.3 |
|
1961 |
82 |
18.0 |
|
1971 |
80.1 |
19.9 |
|
1981 |
76.7 |
23.3 |
|
1991 |
74.3 |
25.7 |
What are the salient features of a flow map?
What are the points to be kept in mind while using dot method?
Sponsor Area
Sponsor Area