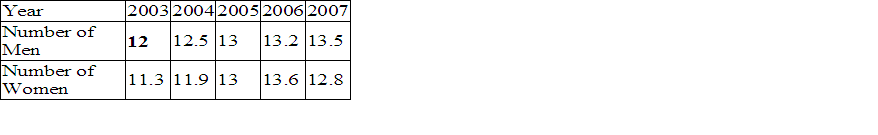
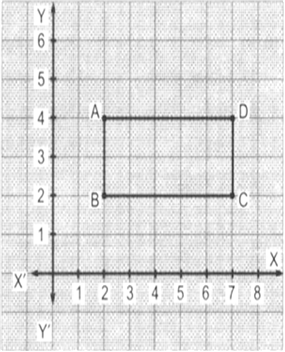
Look at the graph of a rectangle in the figure. What are the coordinates of its vertices?

Solution not provided.
Ans. A(2, 4), B(2, 2), C(7, 2), D(7, 4)
Solution not provided.
Ans. A(2, 4), B(2, 2), C(7, 2), D(7, 4)
Population (in thousands) of men and women in a village in different years.
Ratana fell sick. Her doctor maintained a record of her hody temperature, taken every four hours. It is shown in the following time-temperature graph.
(a) During which period the temperature showed a rising trend?
(b) During which period the temperature showed a downward trend?
(c) At what time the temperature was highest?
(d) At what time the temperature was lowest?
Plot the following points on a graph sheet. Verify if they lie on a line:
(a) A (4, 0), B(4, 2), C(4, 6), D(4, 2.5)
(b) P(1, 1), Q(2, 2), R(3, 3), S(4, 4)
(c) K(2, 3), L(5, 3), M(5, 5), N(2, 5)
Mock Test Series