Question
The graph shows the yearly sales figure of a shoe manufacturing company.
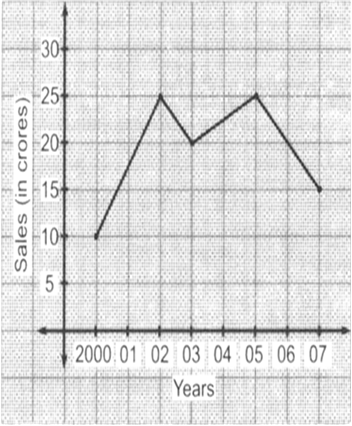
(i) What were the sales in 2000?
(ii) In which year the sales were maximum?
(iii) What is the difference between the sales in the year 2003 and 2005?
Solution
Solution not provided.
Ans. (i) 10 crores
(ii) in 2002 and 2005
(iii) 0