Question
Draw the graph for the following table of values of time (in hours) and distances (in km) covered by a car. From the graph, find:
(i) The distance covered by the car during the period 7:00 to 8 :00.
(ii) At what time the car would have covered 180 km?

Solution
By plotting the points (7:00, 60), (8:00, 120), (9:00, 180) and (10:00, 240), we get a straight line.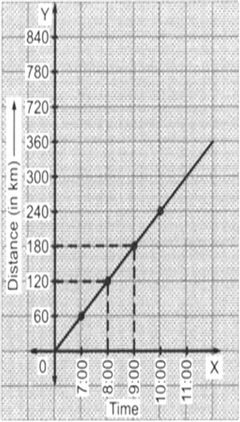
(i) Distance covered during 7:00 and 8:00 = (180 – 120) km = 60 km.
(ii) From the graph the car would have covered 180 km at 9:00.