Question
Following graph describes the distance of a car from a city-P to city-Q, which are 350 km apart. Study the graph and answer the following questions.
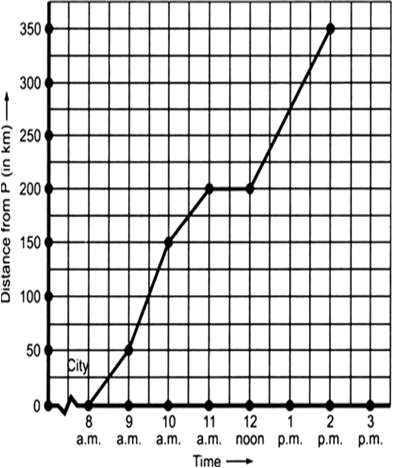
(a) What information is given on the two axes?
(b) From where and when did the car begin its journey?
(c) How far did the car go in the first hour?
(d) How far did the car go during (i) the 2nd hour? (ii) the 3rd hour?
(e) Was the speed same during the first three hours? How do you know it?
(f) Did the car stop for some duration at any place? Justify your answer.
(g) When did the car reach City Q?
Solution
(a) x-axis  time; y-axis
  Distance from p
(b) At 8: a.m. from city-p
(c) 50 km
(d) (i) 100 km (from 50 km, 5 to 150 km)
(ii) 50 km(150 km to 200 km)
(e) It was same during 1st, 2nd hour and 3rd year.
(f) Yes, no distance covered during 11 a.m. to 12 noon.
(g) At 2 p.m.