Sponsor Area
Explain the effects of 'maximum price ceiling' on the market of a good'? Use diagram.
A price ceiling is a government-imposed price control or limit on how high a price is charged for a product. Governments intend price ceilings to protect consumers from conditions that could make necessary commodities unattainable. It is the legislated or government imposed maximum level of price that can be charged by the seller. Since price ceiling is lower than the equilibrium price thus the imposition of the price ceiling leads to excess demand as shown in the diagram below.
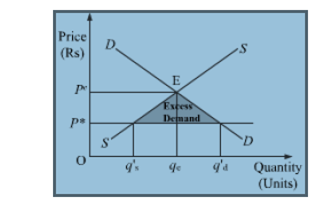
The following are the consequences and effects of price ceiling:
1) An effective price ceiling will lower the price of a good, which decreases the producer surplus. The effective price ceiling will also decrease the price for consumers,but any benefit gained from that will be minimized by the decreased sales due to the drop in supply caused by the lower price.
2) If a ceiling is to be imposed for a long period of time, a government may need to ration the good to ensure availability for the greatest number of consumers.
3) Prolonged shortages caused by price ceilings can create black markets for that good.
4) Due to artificially lowering the price, the demand becomes comparatively higher than the supply. This leads to the emergence of the problem of excess demand.
5) The imposition of the price ceiling ensures the access of the necessity goods within the reach of the poor people. This safeguards and enhances the welfare of the poor and vulnerable sections of the society.
6) Each consumer gets a fixed quantity of good (as per the quota). The quantity often falls short of meeting the individual’s requirements. This further leads to the problem of shortage and the consumer remains unsatisfied.
7) Often it has been found that the goods that are available at the ration shops are usually inferior goods and are adulterated and infiltrated.
Why is the equality between marginal cost and marginal revenue necessary for a firm to be in equilibrium? Is it sufficient to ensure equilibrium? Explain.
Equilibrium refers to a state of rest when no change is required. A firm (producer) is said to be in equilibrium when it has no inclination to expand or to contract its output. This state either reflects maximum profits or minimum losses.
According to MC=MR approach, As long as MC is less than MR, it is profitable for the producer to go on producing more because it adds to its profits. He stops producing more only when MC becomes equal to MR.
When MC is greater than MR after equilibrium, it means producing more will lead to decline
in profits.
Both the conditions are needed for Firm’s Equilibrium:
1. MC = MR:
MR is the addition to TR from sale of one more unit of output and MC is addition to TC for
increasing production by one unit. Every producer aims to maximize the total profits. For
this, a firm compares it’s MR with its MC. Profits will increase as long as MR exceeds MC
and profits will fall if MR is less than MC. So, equilibrium is not achieved when MC < MR
as it is possible to add to profits by producing more. Producer is also not in equilibrium
when MC > MR because benefit is less than the cost. It means, the firm will be at
equilibrium when MC = MR.
2. MC is greater than MR after MC = MR output level:
MC = MR is a necessary condition, but not sufficient enough to ensure equilibrium. Only
that output level is the equilibrium output when MC becomes greater than MR after the
equilibrium.
It is because if MC is greater than MR, then producing beyond MC = MR output will reduce
profits. On the other hand, if MC is less than MR beyond MC = MR output, it is possible to
add to profits by producing more. So, first condition must be supplemented with the
second condition to attain the producer’s equilibrium.
Market for a good is in equilibrium. The demand for the good 'increases'. Explain the chain of effects of this change.
Equilibrium is defined as a situation where the plans of all consumers and firms in the market match and the market clears. When the supply and demand curves intersect, the market is in equilibrium. This is where the quantity demanded and quantity supplied are equal. The corresponding price is the equilibrium price or market-clearing price, the quantity is the equilibrium quantity.
Suppose D1 and S1 are the initial market demand curve and the initial market supply curve, respectively. The initial equilibrium is established at point E1, where the market demand curve and the market supply curve intersects each other. Accordingly, the equilibrium price is OP1 and the equilibrium quantity demanded is Oq1.
Now, if there is an increase in the market demand, the market demand curve shifts parallely rightwards to D2 from D1, while the market supply curve remains unchanged at S1. This implies that at the initial price OP1, there exist excess demand equivalent to (Oq'1 - Oq1) units. This excess demand will increase competition among the buyers and they will now be ready to pay a higher price to acquire more units of the good. This will further raise the market price. The price will continue to rise till it reaches OP2. The new equilibrium is established at point E2, where the new demand curve D2 intersects the supply curve S1.
Hence, an increase in demand with supply remaining constant, results in rise in the equilibrium price as well as the equilibrium quantity.
Market of a commodity is in equilibrium. Demand for the commodity "increases." Explain the chain of effects of this change till the market again reaches equilibrium. Use diagram.
An increase in the demand for the commodity leads to an increase in the equilibrium price and quantity.
Here,
D1D1 and S1S1 represent the market demand and market supply respectively. The initial equilibrium occurs at E1, where the demand and the supply intersect each other. Due to the increase in the demand for the commodity, the demand curve will shift rightward parallel fromD1D1 to D2D2, while the supply curve will remain unchanged. Hence, there will be a situation of excess demand, equivalent to (q1' − q1). Consequently, the price will rise due to excess demand. The price will continue to rise until it reaches E2 (new equilibrium), where D2D2 intersects the supply curve S1S1. The equilibrium price increases from P1 to P2 and the equilibrium output increases from q1 to q2.
Giving reasons, state whether the following statements are true or false.
A monopolist can sell any quantity he likes at a price.
False, a monopolist cannot sell any quantity he likes at a price because the monopolist controls only the supply and not the demand. A monopolist can only determine one of two things. It has to be either price or quantity; this is because there is a fixed price consumers are willing to pay for a given quantity. As a result a monopolist can only charge the price corresponding to the specific quantity he has set otherwise the goods he has produced won’t be sold. This is because he has no control over the quantity that he can sell in the market. Rather, it depends on the buyers that what quantity of output they want to purchase at the price fixed by the monopolist. If the monopolist fixes a higher price, then lesser quantity of the output will be demanded and lesser quantity will be sold in the market. On the other hand, if he fixes a lower price, then higher quantity of the good will be sold.
True, when equilibrium price of a good is less than its market price then there will be competition among the sellers. At a price lower than market price, there will be more supply. This is explained with the help of the following diagram.
In the above diagram, point E is the equilibrium point, where the market demand curve DD and the market supply curve SS intersects each other. At this point the equilibrium price is OP and the equilibrium quantity is OQe
Now, suppose the market price is OPo, the equilibrium price is less than the market price. At this price the market demand is OQd and the market supply is OQs. Clearly, market supply is more than the market demand. So, there exists a situation of excess supply. Due to excess supply, there will exist competition among the sellers.
Market for a good is in equilibrium. There is simultaneous increase both in demand and supply of the good. Explain its effect on market price.
The simultaneous increase in demand and supply affects the equilibrium price and output depending on the magnitude of the change in demand and supply. The simultaneous increase in the demand and supply can be bifurcated into the following three conditions.
i. When Demand and Supply Increase in the Same Proportion
According to the diagram, E1 is the initial equilibrium with equilibrium price P1 and equilibrium output q1.
Now let us suppose the demand increases to D2D2 and the supply increases to S2S2 by the same proportion to that of demand. The new demand curve and the new supply curve intersect at point E2, which is the new equilibrium point. At the new equilibrium point, new equilibrium output is q2, while the equilibrium price remains the same at P1. Thus, an increase in the demand and the supply by same proportion leaves the equilibrium price unchanged.
ii. When Demand Increases More than Increase in Supply
The initial demand curve and the initial supply curve intersect each other at point E1, with initial equilibrium price P1 and initial equilibrium output Q1.
Now let us suppose that demand increases and thereby demand curve shifts to D2. Simultaneously, the supply also rises and the supply curve shift to S2. However, the increase in the supply is less than the increase in the demand. The new supply curve and the new demand curve intersect each other at point E2, with higher equilibrium price P2 and higher equilibrium output Q2. Thus, when the demand increases more than the increase in supply, the equilibrium price rises.
iii. When Demand Increases but Lesser than the Increase in Supply
Let the initial equilibrium be at point E1, with the equilibrium price P1 and the equilibrium output Q1. Now, suppose that the demand increases to D2 and supply increases to S2. However, the increase in supply is more than that of the increase in demand. The new demand curve D2 and the new supply curve S2 intersect at point E2, with lower equilibrium price P2. Thus, when the increases in demand is less than the increase in supply, the equilibrium price falls.
Market for a good is in equilibrium. There is simultaneous decrease both in demand and supply of the good. Explain its effect on market price.
The simultaneous decrease in demand and supply affects the equilibrium price and output depending on the magnitude of the change in demand and supply. The simultaneous decrease in the demand and supply can be bifurcated into the following three conditions.
i. When Demand and Supply Decrease in the Same Proportion
Let S1 and D1 be the initial supply curve and the initial demand curve respectively. The initial equilibrium is at point E1, with equilibrium price at P1 and equilibrium output Q1.
Suppose that both demand and supply decrease by the same proportion. Consequently, the demand curve shifts to D2 and the supply curve shifts to S2. The new equilibrium is at point at E2 with lower equilibrium output Q2 but the same equilibrium price P1. Thus, when both demand and supply decrease in the same proportion, the equilibrium price remains the same, but the equilibrium quantity falls.
ii. When Demand Decreases more than the Decrease in Supply
Let D1 and S1 be the initial demand curve and the initial supply curve, respectively. The initial equilibrium is at point E1 with equilibrium price P1 and equilibrium output Q1.
Now let us suppose that demand decrease to D2 and supply decreases by lesser proportion to S2. Consequently, the new equilibrium is established at point E2. At the new equilibrium, the equilibrium price falls to P2 and equilibrium output falls to Q2. Thus, when decrease in demand is more than the decrease in supply, the equilibrium price falls accompanied by the fall in equilibrium output.
iii. When Decrease in Demand is lesser than Decrease in Supply.
Let the initial equilibrium be at point E1, determined by the intersection of the initial demand curve D1 and the initial supply curve S1. The equilibrium price is P1 and the equilibrium output is Q1.
Now suppose that the demand decreases but lesser than the decrease in the supply. The demand curve shifts to D2 while the supply curve shifts to S2. The new equilibrium determined by the intersection of D2 and S2 is at point E2, where the equilibrium price increases to P2 and the equilibrium quantity falls to Q2. Thus, when decrease in demand is lesser than the decrease in supply then the equilibrium price rises and equilibrium output falls to Q2.
Market for a good is in equilibrium. There is an 'increase' in demand for this good. Explain the chain of effects of this change. Use diagram.
An equilibrium is defined as a situation where the plans of all consumers and firms in the market match and the market clears. When the supply and demand curves intersect, the market is in equilibrium. This is where the quantity demanded and quantity supplied are equal. The corresponding price is the equilibrium price or market-clearing price, the quantity is the equilibrium quantity.
Suppose D1 and S1 are the initial market demand curve and the initial market supply curve, respectively. The initial equilibrium is established at point E1, where the market demand curve and the market supply curve intersects each other. Accordingly, the equilibrium price is OP1 and the equilibrium quantity demanded is Oq1.
Now, if there is an increase in the market demand, the market demand curve shifts parallelly rightwards to D2 from D1, while the market supply curve remains unchanged at S1. This implies that at the initial price OP1, there exist excess demand equivalent to (Oq'1 - Oq1) units. This excess demand will increase competition among the buyers and they will now be ready to pay a higher price to acquire more units of the good. This will further raise the market price. The price will continue to rise till it reaches OP2. The new equilibrium is established at point E2, where the new demand curve D2 intersects the supply curve S1
Hence, an increase in demand with supply remaining constant, results in rise in the equilibrium price as well as the equilibrium quantity.
What is minimum price ceiling? Explain its implications.
Minimum price ceiling means the least price that could be paid for a good or service. It is the price fixed by the government for a good in the market. The government fixes the price on agricultural products and food grains in particular so that the farmers get their fair price of a commodity which otherwise actually can be sold with too low of a price.
Effects of price floor:
(i) Minimum Return: Farmers are ensured with the minimum returns as their products are completely sold in the market at comparatively higher price. This leads to an increase in their level of income.
(ii) Maximum Level of output: The government ensures to buy the full produce of the farmers which are not sold in the market at the price floor. Hence, they are able to produce the maximum level of output.
(iii) Burden on Government: It also puts extra burden on the government revenues. It becomes mandatory for the government to purchase the excess produce, even if it runs a sufficient volume of buffer stocks.
(iv) Higher Taxes: The government also tries to shift the burden (associated with purchasing the excess produce at higher price) to the consumers and the traders in form of higher taxes.
If the prevailing market price is above the equilibrium price, explain its chain of effects.
When the price is above the equilibrium market price of a good (OP), the price ceiling leads to excess of supply. In the diagram, the equilibrium price and quantity are OP and OQ. As the equilibrium price is low for farmers, the government fixes the price floor, i.e. the price level increased from OP to OP1 which leads to a decline in the quantity demand, and therefore, there is excess supply in the market. Here, the competition will increase among the sellers, and hence, the price will come down to the equilibrium point where market demand is equal to market supply.
The demand of a commodity when measured through the expenditure approach is inelastic. A fall in its price will result in :
(choose the correct alternative)
(a) no change in expenditure on it.
(b) increase in expenditure on it.
(c) decrease in expenditure on it.
(d) any one of the above
(c) decrease in expenditure on it.
Define market demand.
Market demand is the aggregate quantity demanded of a commodity by all the consumers, who are willing to purchase at a given price during a given period of time.
Show that demand of a commodity is inversely related to its price.
Explain with the help of utility analysis.
Or
Why is an indifference curve negatively sloped? Explain.
The demand of a commodity is inversely related to its price, suppose a consumer consumes a good X and its price falls. in that case, the consumer will get a greater marginal utility by consuming good X than the other goods. Thus, he will increase the consumption of good X and its demand will increase. however, in case the price rises, the consumer will get lower utility from the consumption of good X and thus, he will reduce the demand for it.
price of commodity X | demand of commodity of X |
10 | 100 |
15 | 50 |
20 | 25 |
25 | 15 |
This analysis of the above schedule shows that quantity demanded of a commodity holds a negative relationship with the price.
It shows that a higher price of quantity demanded of X falls and vice versa. as the price increases from Rs 10 to Rs 15, the quantity demanded falls from 100 units to 50 units.
When price of a commodity X falls by 10 per cent, its demand rises from 150 units to 180 units. Calculate its price elasticity of demand. How much should be the percentage fall in its price so that its demand rises from 150 to 210 units ?
Given that
Percentage fall in price = 10
Initial demand = 150
New demand = 180
% Increase in demand = 30 × 100 = 20%
150
As we know that
ed= % Change in demand = -20 = -2
% Change in price 10
if demand increase from 150 to 210
% Change in demand = 60 × 100 = 40%
150
% Change in price = % Change in demand = 40 = -20
ed 2
Hence, the price will fall by 20% if the demand will increase from 150 to 210.
Complete the following table :
output units | total cost | average variable cost | marginal cost | average fixed cost |
0 | 30 | |||
1 | 20 | |||
2 | 68 | |||
3 | 84 | 18 | ||
4 | 18 | |||
5 | 125 | 19 | 6 |
output units | total cost | average variable cost | marginal cost | average fixed cost |
0 | 30 | |||
1 | 50 | 20 | 20 | 30 |
2 | 68 | 19 | 18 | 15 |
3 | 84 | 18 | 16 | 10 |
4 | 102 | 18 | 18 | 7.5 |
5 | 125 | 19 | 23 | 6 |
Sponsor Area
Good Y is a substitute of good X. The price of Y falls. Explain the chain of effects of this change in the market of X.
Or
Explain the chain of effects of excess supply of a good on its equilibrium price.
Substitute goods refer to goods which can be consumed instead of each other. For example, tea and coffee are substitute goods. If X and Y are substitute goods, then a fall in the price of good Y will lead to a fall in the demand of good X. this is because with a fall in the price of good Y, it will become cheaper in comparison to good X, and the demand for good Y will increase and that of good X will fall.
According to the diagram, DD is the initial demand curve for good X. At price OP, OQ quantity of good X is demanded. With a fall in the price of good Y, the demand for good X falls. Accordingly, the demand curve for good X shifts parallelly leftwards to D′D′. Here, even at the existing price OP, the quantity demand of good X falls to OQ′.
or,
Chain effects of excess supply of a good on its equilibrium price
Consider DD to be the initial demand curve and SS to be the supply curve of the market. Market equilibrium is achieved at Point E, where the demand and supply curves intersect each other. Therefore, the equilibrium price is OP, and the equilibrium quantity demanded is OQ. When there is change in other factors than price, there will be rise in the supply of goods. There will be a shift in the supply curve towards the right to SS1 with an increase in the supply, and the demand curve DD will remain the same. This implies that there will be a situation of excess supply at the equilibrium point.
In the above diagram, there is an excess supply of OQ1 to OQ1
1 units of output at the initial price OP1. Thereby the producers will tend to reduce the price of the output to increase the sale in the market. Profit margin of the firm will come down and slowly some of the firms will tend to quit the market. Because of this, the market supply will decline to OQ2 level of output and the price of the output also gets reduce to the point OP2. Now, the new market equilibrium will be at Point E1, where the new supply curve SS1 intersects the demand curve DD.
At a given price, when demand for commodity is more then supply of the commodity then it is called excess demand. Here given price is:
less than equilibrium price
more than equilibrium price
less than or equal to equilibrium price
More than or equal to equilibrium price
A.
less than equilibrium price
At a given price, when demand for commodity is more than supply of the commodity then it is called excess demand. Here given price is
less than equilibrium price
more than equilibrium price
less than or equal to equilibrium price
More than or equal to equilibrium price
A.
less than equilibrium price
Price ceiling refers to
Max. retail price
Max. price the buyer is willing to pay
Max. price at which seller is willing to sell.
Max. price the producer is legally allowed to charge.
D.
Max. price the producer is legally allowed to charge.
Define equilibrium price.
Equilibrium price refers to that price which equates market demand for a commodity with its market supply.
Define Price Ceiling.
Price Ceiling refers to the maximum price of a commodity lower than equilibrium price at which the seller can legally sell their product.
Explain why the equilibrium price of a commodity is determined at that level of output at which its demand equals its supply.
Suppose demand is greater than supply. Since the buyers will not be able to buy all what they want, there will be competition among the buyers. It will have an upward influence on the price. As a result, demand will start falling and supply starts rising. It will go on till the demand is equal to supply again. If demand is less than supply, the sellers will not be able to sell all what they want, there will be competition among the sellers. It will have a downward influence on the price. As a result, demand will start rising and supply starts falling. It will go on till the demand is equal to supply again. Hence, the equilibrium price of a commodity is determined at that level of output at which its demand equals its supply.
Sponsor Area
Sponsor Area