☰
Introduction to Graphs
(a) How high was plant A after (i) 2 weeks and (ii) 3 weeks?
(b) How high was plant B after (i) 2 weeks and (ii) 3 weeks?
(c) How much did plant A grow during the 3rd week?
(d) How much did plant B grow from the end of the 2nd week to the end of the 3rd week?
(e) During which week did plant A grow most?
(f) During which week did plant B grow least?
(g) Were the two plants of the same height during any week shown here? Specify.
(a) (i) After 2 weeks: The plant A was 7 cm high. (ii) After 3 weeks:The plant A was 9 cm high.
(b) (i) After 2 weeks: The plant B was 7 cm high. (ii) After 3 weeks: The plant B was 10 cm high.
(c) During the 3rd week, the plant grew (9 cm – 7 cm), i.e. 2 cm.
(d) The plant B grew 10 cm – 7 cm = 3 cm from the end of 2nd week to the end of the 3rd week.
(e) The growth of the plant A:
During the 1st week = 1 cm – 0 cm = 1 cm, During the 2nd week = 7 cm – 1 cm = 6 cm, During the 3rd week = 9 cm – 7 cm = 2 cm. Thus, during the 2nd week, the plant A grew the must.
(f) The growth of the plant B during:
the 1st week = 1 cm – 0 cm = 1 cm
the 2nd week = 7 cm – 1 cm = 6 cm
the 3rd week = 10 cm – 7 cm = 3 cm
Thus, the plant-B grew the least in the first week.
(g) Both the plants have shown almost the same height at the end of the 2nd week.


Sponsor Area
Ratana fell sick. Her doctor maintained a record of her hody temperature, taken every four hours. It is shown in the following time-temperature graph.
(a) During which period the temperature showed a rising trend?
(b) During which period the temperature showed a downward trend?
(c) At what time the temperature was highest?
(d) At what time the temperature was lowest?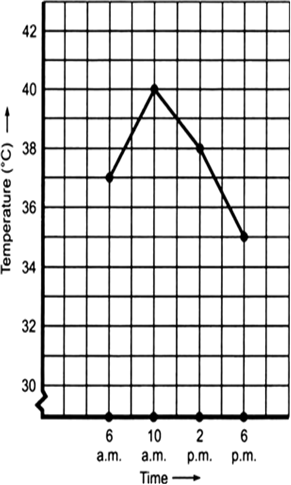
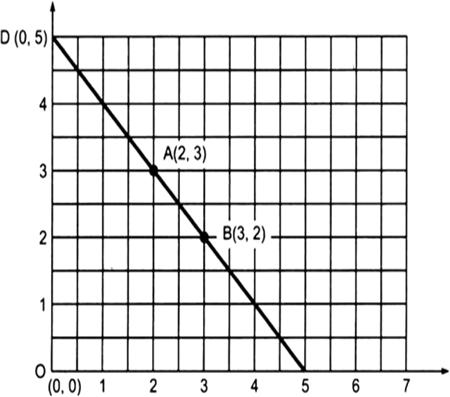
Plot the following points on a graph sheet. Verify if they lie on a line:
(a) A (4, 0), B(4, 2), C(4, 6), D(4, 2.5)
(b) P(1, 1), Q(2, 2), R(3, 3), S(4, 4)
(c) K(2, 3), L(5, 3), M(5, 5), N(2, 5)
Sponsor Area
Sponsor Area