☰
Data Handling
To represent the given data by a bar-graph, draw two axes perpendicular to each other. Now, represent ‘Months’ on OX and ‘Number of watch sold’ on OY. Erect rectangles of the same width. The heights of the rectangles are proportional to number of watches, using a suitable scale:
Here, scale is 1 cm = 500 watches
Since 500 watches = 1 cm
1000 watches = 2 cm
1500 watches = 3 cm
2000 watches = 4 cm
2500 watches = 5 cm


Sponsor Area
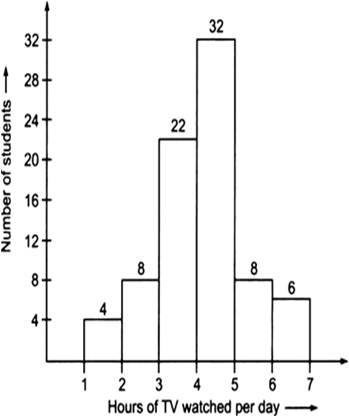
For which of these would you use a histogram to show the data?
(a) The number of letters for different areas in a postman’ bag.
(b) The height of competitors in an athletics meet.
(c) The number of cassettes produced by 5 companies.
(d) The number of passengers boarding trains from 7:00 a.m. to 7:00 p.m. at a station.
Give reasons for each.
The weekly wages (in Rs) of 30 workers in a factory are:
830, 835, 890, 810, 835, 836, 869, 845, 898, 890, 820, 860, 832, 833, 855, 845, 804, 808, 812, 840, 885, 835, 835, 836, 878, 840, 868, 890, 806, 840
Using tally marks make a frequency table with intervals as 800–810, 810-820 and so on.
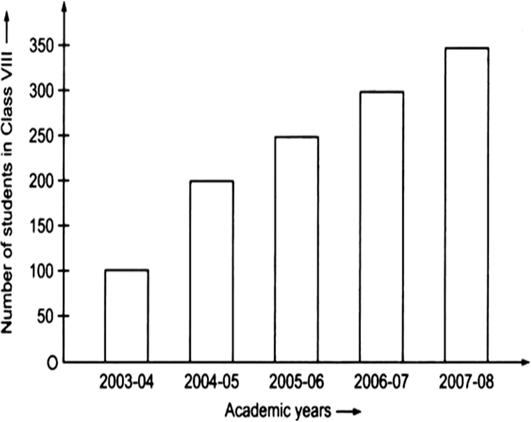
(i) What is the information given by the bar graph?
(ii) In which year is the increase in the number of students is maximum?
(iii) In which year is the number of students maximum?
(iv) Is the number of students during 2005-06 twice that of 2003-04?
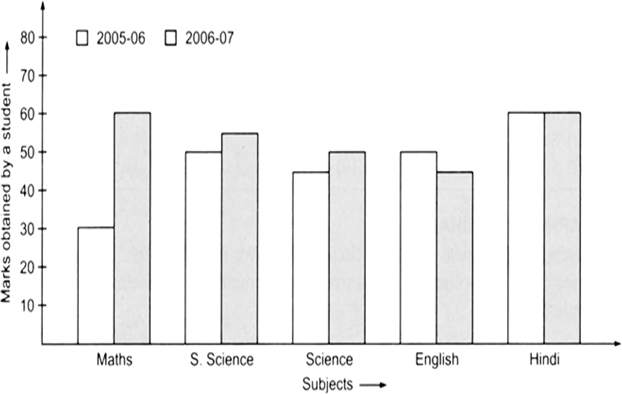
(i) What is the information given by the double bar graph?
(ii) In which subject has the performance improved the most?
(iii) In which subject the performance deteriorated?
(iv) In which subject is the performance at par?
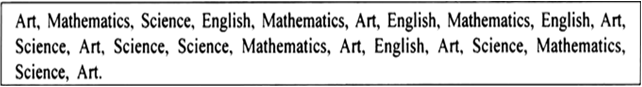
Answer the following questions:
(i) Which is the most liked subject?
(ii) Which is the least liked subject?
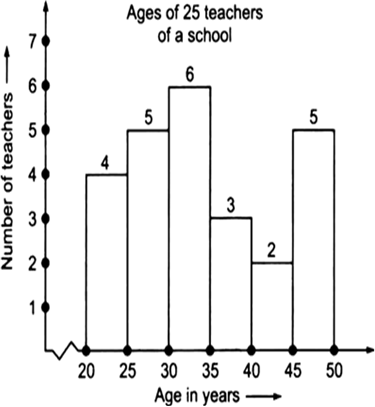
(i) How many teachers are of age 45 years or more but less than 50 years?
(ii) How many teachers are of age less than 35 years?
Sponsor Area
Sponsor Area