☰
Graphical Representation Of Data
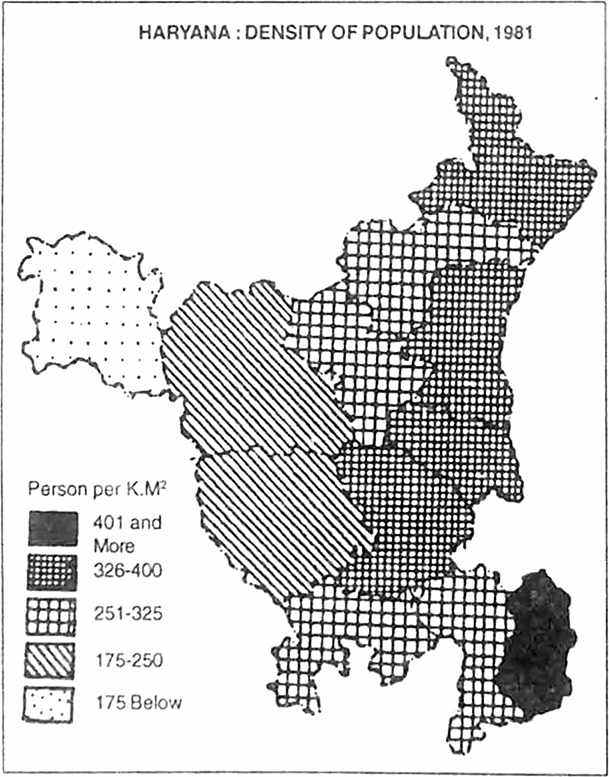
Draw a coropleth map of Haryana showing the population data as given below:
Haryana District-wise Population, 1981
|
S.N. |
District |
Population |
Area (Km2) |
Density of Population |
|
1. |
Hisar |
1496534 |
6315 |
237 |
|
2. |
Sirsa |
776068 |
4276 |
165 |
|
3. |
Bhiwani |
920052 |
5099 |
180 |
|
4. |
Gurgaon |
849598 |
2716 |
313 |
|
5. |
Faridabad |
1000859 |
2150 |
466 |
|
6. |
Jind |
938074 |
3306 |
284 |
|
7. |
Mahender garh |
959400 |
3610 |
319 |
|
8. |
Ambala |
1409463 |
3332 |
368 |
|
9. |
Kamal |
1322826 |
3721 |
356 |
|
10. |
Kurukshetra |
1130026 |
3740 |
302 |
|
11. |
Rohtak |
1341953 |
3841 |
349 |
|
12. |
Sonepat |
846765 |
2206 |
384 |
Construction: Select the suitable interval keeping the maximum and minimum density of population. The interval is given below : 175,175-250, 251-325, 326-400 above 401.
Now select the shade according to increasing population.


Sponsor Area
Which one of the following maps is known as 'Dynamic Map' ?
What is a thematic map?
Differentiate between multiple bar diagram and compound bar diagram.
What are the requirements to construct a dot map?
Describe the method of constructing a traffic flow map.
What is an isopleth map? How an interpolation is carried out?
Describe and illustrate important steps to be followed in preparing a choropleth map.
Discuss important steps to represent data with the help of pie-diagram.
Represent the following data with the help of suitable diagram:
|
Year |
1911 |
1921 |
1931 |
1941 |
1951 |
1961 |
1971 |
1981 |
1991 |
2001 |
|
Decimal Growth (%) |
0.35 |
8.27 |
19.12 |
31.97 |
41.42 |
26.41 |
38.23 |
46.14 |
36.47 |
31.13 |
Represent the following data with the help of suitable diagram:
India: Literacy and Enrolment Ratio in Primary and Upper Primary Schools
|
Year |
Literacy Ratio |
Enrolment |
Enrolment Ratio |
||||||
|
Ratio Primary |
Upper Primary |
||||||||
|
Person |
Male |
Female |
Boys |
Girls |
Total |
Boys |
Girls |
Total |
|
|
1950-51 |
18.3 |
27.2 |
8.86 |
60.6 |
25 |
42.6 |
20.6 |
4.6 |
12.7 |
|
1999-2000 |
65.4 |
75.8 |
54.2 |
104 |
85 |
94.9 |
67.2 |
50 |
58.8 |
Sponsor Area
Sponsor Area