☰
Graphical Representation Of Data
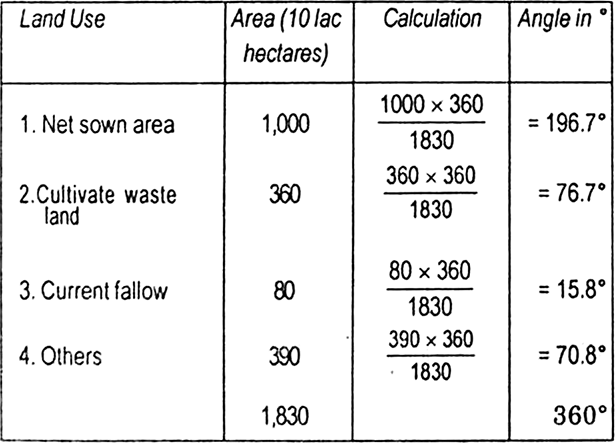
In the following table land-use data of India is given:
Land Use Area (10 lac __hectares)
1. Net sown area 1,000
2. Cultivable waste 360
3. Current fallow 80
4. Others__390
Total 1,830
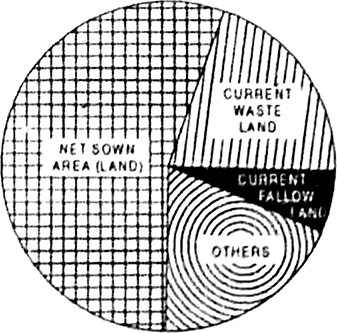
Represent the above data by a suitable diagram.
The suitable diagram will be Pie Diagram. Before constructing Pie Diagram decide the angles for each item. Table:
The same is done in the form of a table.
Tips: -
Imp.


Sponsor Area
Which one of the following is best suited to represent the decadal growth of population?
Polygraph is constructed to represent:
Which one of the following maps is known as 'Dynamic Map' ?
What is a thematic map?
Differentiate between multiple bar diagram and compound bar diagram.
What are the requirements to construct a dot map?
Describe the method of constructing a traffic flow map.
What is an isopleth map? How an interpolation is carried out?
Describe and illustrate important steps to be followed in preparing a choropleth map.
Discuss important steps to represent data with the help of pie-diagram.
Sponsor Area
Sponsor Area