☰
Data Processing
With the help of data given calculate Standard Deviation.
15, 18, 20, 12, 10, 9, 11.
Calculation of Standard Deviation:
|
Values |
X – |
d2 |
|
X |
|
|
|
15 |
3 |
9 |
|
18 |
6 |
36 |
|
20 |
8 |
64 |
|
12 |
0 |
0 |
|
10 |
-2 |
4 |
|
9 |
-3 |
9 |
|
11 |
-1 |
1 |
|
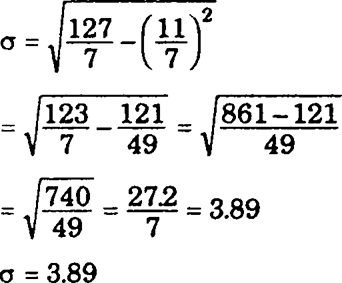
N = 7 |
Σd = 11 |
Σd2 = 123 |
Apply the formula = Standard Deviation or
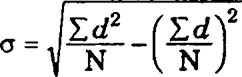
After putting the values


Sponsor Area
What are the advantages of using mode?
What is dispersion?
Define Correlation.
What is perfect correlation?
What is the maximum extent of correlation?
What is perfect correlation ?
Explain relative position of mean, median and mode in a normal distribution and skewed distribution with the help of diagram.
Comment on the applicability of mean, median and mode.
Explain the process of computing Standard Deviation with the help of an imaginary example.
Which measures of dispersion is the most unstable statistic and why?
Sponsor Area
Sponsor Area

 = d12
= d12