Question
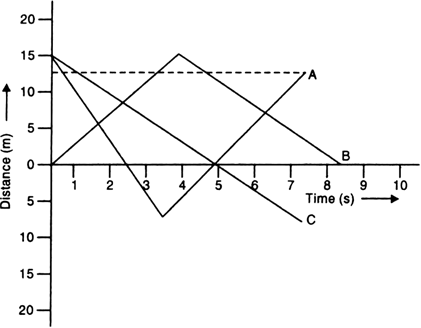
Discuss the graphs A, B and C shown in Fig. 8.21. Compare the total distance travelled and the displacements. Which graph represents a motion in which total displacement is zero?
Solution
(i) In graph A,
Total distance travelled = 15 + 7.5 + 7.5 + 12.5
= 42.5 m
Graph B,
Total distance travelled = 15 + 15 = 30 m
Graph C,
Total distance travelled in graph C = 15 + 7.5 = 22.5 m.
(ii) Displacement is the shortest distance between the initial and final positions.
∴ Displacement in graph A = 12.5 – 15 = – 2.5 m.
Displacement in graph B = 0 – 0 = 0m. [ Because the object is returning back to the initial point]
Displacement in graph C = – 7.5 - 15 = – 22.5 m.
(iii) In graph B,
Before t = 4 s, the velocity is positive and after t = 4 sec, velocity is negative.
So the acceleration is negative at t = 4 s in graph B.