Question
Draw a graph of ∆PQR, the coordinates of whose vertices are P(9, 5), Q(7, 7) and C(9, 9).
Solution
Solution not provided.
Solution not provided.
Ratana fell sick. Her doctor maintained a record of her hody temperature, taken every four hours. It is shown in the following time-temperature graph.
(a) During which period the temperature showed a rising trend?
(b) During which period the temperature showed a downward trend?
(c) At what time the temperature was highest?
(d) At what time the temperature was lowest?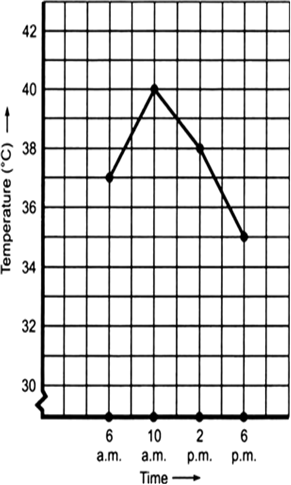
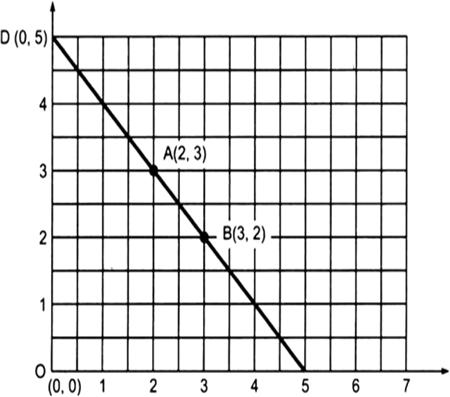
Plot the following points on a graph sheet. Verify if they lie on a line:
(a) A (4, 0), B(4, 2), C(4, 6), D(4, 2.5)
(b) P(1, 1), Q(2, 2), R(3, 3), S(4, 4)
(c) K(2, 3), L(5, 3), M(5, 5), N(2, 5)
Mock Test Series


