Question
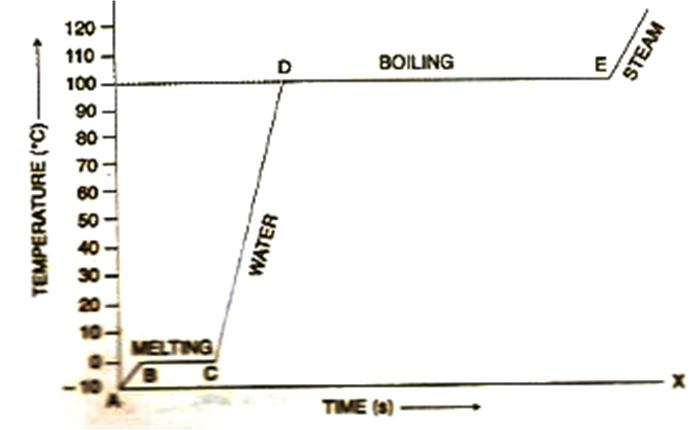
A piece of ice at 0o C is heated at a constant rate and its temperature recorded at regular intervals till steam is formed at 100o C. Draw a temperature-time graph to represent the change in phase? Label the different parts of your graph.
Solution
The temperature-time graph represent the change in phase. The graph is as given below: