☰
Wave Optics
The graph shown in the figure represents a plot of current versus voltage for a given semiconductor.
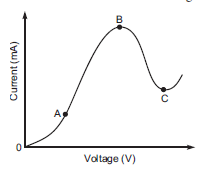
Identify the region, if any, over which the semiconductor has a negative resistance.
The part of the curve BC has a negative slope because with increase in current, voltage decreases.


Sponsor Area
Sponsor Area
Sponsor Area