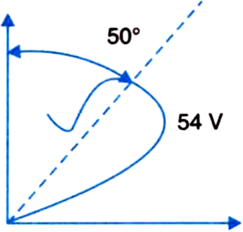
Name the experiment for which the following graph, showing the variation of intensity of scattered electrons with the angle of scattering, was obtained. Also name the important hypothesis that was confirmed by this experiment.
Answer
Short Answer
The following graph shows us the Davisson and Germer’s Experiment. This experiment confirmed the de-Broglie hypothesis.