☰
Current Electricity
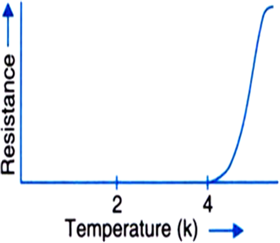
Here, in the given graph the resistance drops abruptly as the temperature is lowered, which is a characteristic trait exhibited by superconductors.
Therefore, the phenomenon of superconductivity is shown by the graph.


Sponsor Area
What conclusion can you draw from the following observations on a resistor made of alloy manganin?
|
Current A |
Voltage V |
Current A |
Voltage V |
|
0.2 0.4 0.6 0.8 1.0 2.0 |
3.94 7.87 11.8 15.7 19.7 39.4 |
3.0 4.0 5.0 6.0 7.0 8.0 |
59.2 78.8 98.6 118.5 138.2 158.0 |
Sponsor Area
Sponsor Area