☰
Poverty As A Challenge
Graph: Number of poor by region ($ 1 per day) in millions.
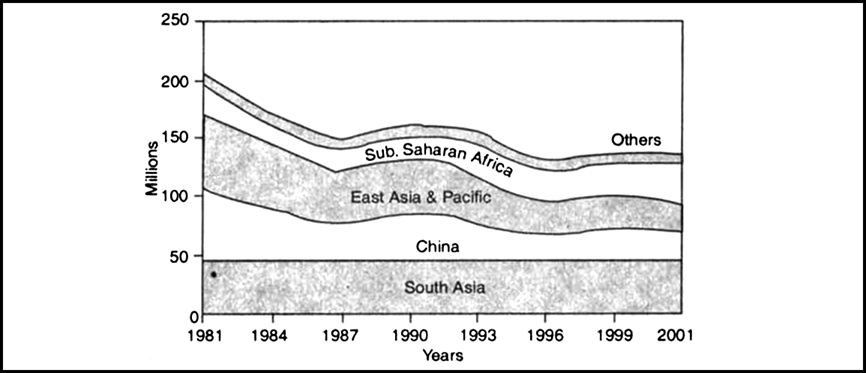
Sources: World Development Indicators 2005. The World Bank. Study the Graph and do the following:
(i) Identify the areas of the world, where poverty ratios have declined.
(ii) Identify the area of the globe which has the largest concentration of the poor.
(i)Poverty ratios have declined in South Asia and Pacific.
(ii)South Asia has the largest concentration of the poor.


Sponsor Area
Give an account of the interstate disparities in poverty in India.
Describe global poverty trends.
Describe current government strategy of poverty alleviation.
What do you understand by human poverty?
Who are the poorest of the poor?
What are the main features of the National Rural Employment Guarantee Act 2005?
Every __________ person is poor in India.
How many crore of people live in poverty in India?
How much calories per person per day are recommended in India?
How much calories are recommended per person per day in rural area of India?
Sponsor Area
Sponsor Area