☰
Is Matter Around Us Pure
How can a transverse wave be represented graphically?
Graphical representation of a transverse wave.
In the fig. given below, the curve represents displacement-distance graph for a transverse wave at any given instant of time. 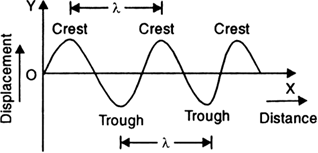
Fig. 12.11. Displacement-distance graph of a transverse wave.
X-axis represents the direction of propagation of the wave.
Y-axis represents the displacements of the particles from their mean positions.
In a transverse wave, the displacements of the particles are perpendicular to the direction of wave motion.
So, the displacement-distance graph is essentially the picture of the wave itself.
The distance between two successive crests or troughs is called wavelength.
It is usually represented by λ (lambda).


Sponsor Area
Which separation techniques will you apply for the separation of the following?
Small pieces of metal in the engine oil of a car.
Which separation techniques will you apply for the separation of the following?
Different pigments from an extract of flower petals.
Which separation techniques will you apply for the separation of the following?
Butter from curd.
Write the steps you would use for making tea. Use the words—solution, solvent, solute, dissolve, soluble, insoluble, filtrate and residue.
Pragya tested the solubility of three different substances at different temperatures and collected the data as given below (results are given in the following table, as grams of substance dissolved in 100 grams of water to form a saturated solution).
|
Substance Dissolved |
Temperature in K |
||||
|
283 |
293 |
313 |
333 |
353 |
|
|
Potassium nitrate |
21 |
32 |
62 |
106 |
107 |
|
Sodium chloride |
36 |
36 |
36 |
37 |
37 |
|
Potassium chloride |
35 |
35 |
40 |
46 |
54 |
|
Ammonium chloride |
24 |
37 |
41 |
55 |
66 |
Sponsor Area
Sponsor Area