

Question
The figure shows an experimental plot for discharging of a capacitor in an R-C circuit. The time constant τ of this circuit lies between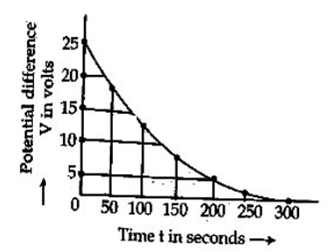
-
150 sec and 200 sec
-
0 and 50 sec
-
50 sec and 100 sec
-
100 sec and 150 sec
Solution
D.
100 sec and 150 sec
Time constant τ is the duration when the value of potential drops by 63% of its initial maximum value (i.e, Vo/e)
Here, 37% of 25 V = 9.25 V which lies between 100s to 150 s in the graphs.


