Question
Plot the graph of the Maxwell’s distribution of speed of gas molecules in equilibrium.
Solution
The graph below shows the Maxwell's distribution of speed of gas molecules in equilibrium.
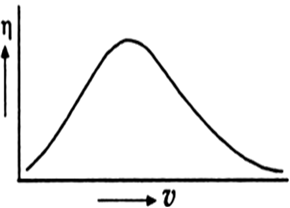
Maxwellian distribution gives the number of molecules between the speeds v and v + dv.
Maxwellian distribution gives the number of molecules between the speeds v and v + dv.


