Draw scatter diagram with the help of following information.
X : 8 10 12 11 9
Y : 5 7 9 8 6

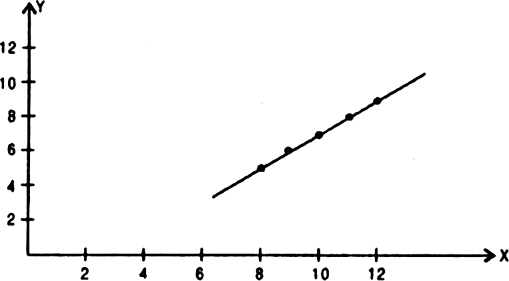
Form the scatter diagram it is clear that there is perfect positive correlation between X and Y variables.
Draw scatter diagram with the help of following information.
X : 8 10 12 11 9
Y : 5 7 9 8 6
Of the following three measures which can measure any type of relationship:
If precisely measured data are available the simple correlation coefficient is:
Why is r preferrred to co-variance as a measure of association?
Can r lie outside -1 and 1 range depending on the type of data?
Does correlation imply causation?
When is rank correlation more precise than simple correlation coefficient?
Does zero correlation mean independenc?
Can simple correlation coefficient measure any type of relationship?
Collect the price of five vegetables from your local market everyday for a week. Calculate their correlation coefficient. Interpret the result.
List some variables where accurate measurement is difficult.
Mock Test Series