How can a longitudinal wave be represented graphically?
Graphical representation of a longitudinal wave: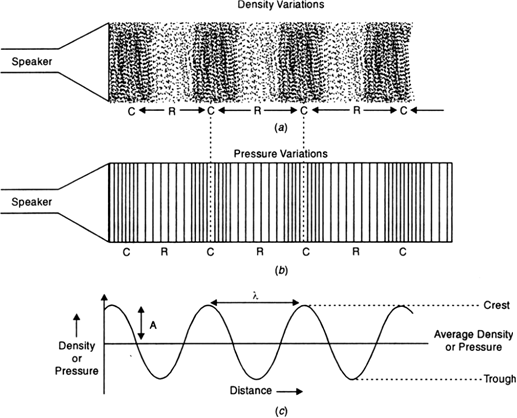
Fig. Sound propagates as density or pressure variations as shown in (a), (b) and (c) represent graphically the density and pressure variations.
i) When a longitudinal wave passes through a medium, the particles of the medium alternately come closer together and move away from one another. Thus, alternate regions of increased and decreased density is created. These regions are called compressions and rarefactions respectively.
ii) In the figure below, (a) and (b) represent the density and pressure variations, respectively as the sound wave propagates through a medium. Fig. (c) represents the variations of density.
iii) The variation of density increases or decreases as the pressure of the medium at a given time increases or decreases with distance, above and below the average value of density and pressure.
iv) The distance between two successive compressions (C) or two rarefactions (R) is called wavelength. It is usually represented by λ (lambda).


