Question
How can a transverse wave be represented graphically?
Solution
Graphical representation of a transverse wave.
In the fig. given below, the curve represents displacement-distance graph for a transverse wave at any given instant of time. 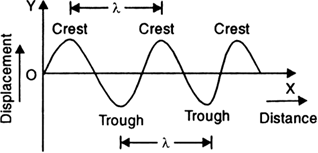
Fig. 12.11. Displacement-distance graph of a transverse wave.
X-axis represents the direction of propagation of the wave.
Y-axis represents the displacements of the particles from their mean positions.
In a transverse wave, the displacements of the particles are perpendicular to the direction of wave motion.
So, the displacement-distance graph is essentially the picture of the wave itself.
The distance between two successive crests or troughs is called wavelength.
It is usually represented by λ (lambda).


