A body moves with a velocity of 2 m/s for 5 s, then its velocity uniformly increases to 10 m/s in next 5 s. Thereafter its velocity begins to decrease at a uniform rate until it comes to rest after 10 s.
(a) Plot a velocity-time and distance-time graph for the motion of the body.
(b) Mark the portions of the graph to show when the motion of the body is uniform and when it is non-uniform.
(c) From the graph find the total distance moved by the body after 2 s and 12 s and in the last 10 s.
(a) Fig. 8.34 shows the velocity-time graph and Fig. 8.35 shows the distance-time graph for the motion of the body.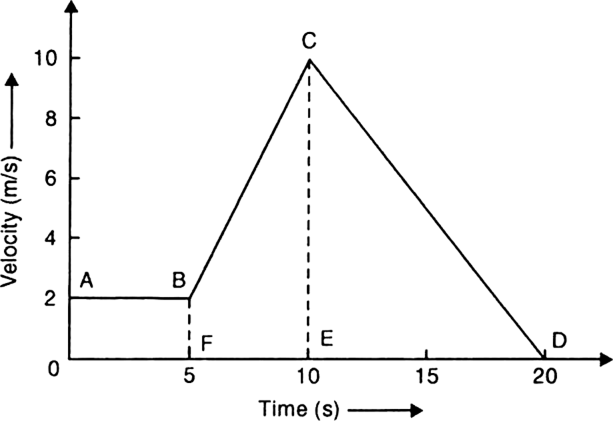
Fig. 8.34. Velocity-time graph.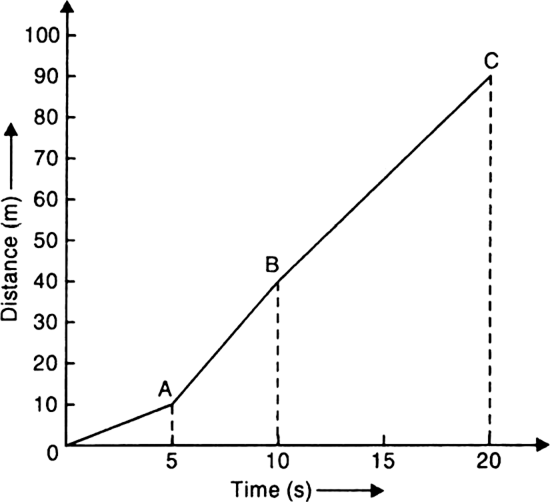
Fig. 8.35. Distance-time graph.
(b) From velocity-time, graph as shown in the fig., we note that the motion is uniform in portion AB and non-uniform in portions BC and CD.
(c) From distance-time graph, we observe the following:
Distance moved after 2 s = 4 m.
Distance moved after 12 s = 50 m.
Distance moved in last 10 s = 90 - 40= 50 m.


