Question
Both figures are shows the speed-time graphs of two cars (a) and (b) respectively.
Using these graphs answer the following questions:
(i) What is the acceleration of the car (a) and car (b) in the first two hours, in the next two hours and in the last two hours?
(ii) What is the total distance travelled by the two cars?
(iii) What is the average speed of the two cars? 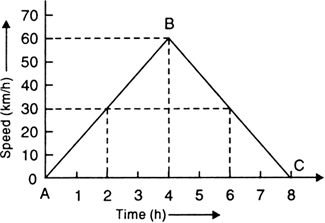
Fig. 8.29
Solution
i) Acceleration of car (a) in first two hours is given by,

Acceleration of car (A) in the next two hours is given by,
Acceleration of car (a) in the last two hours,
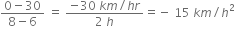
The negative accelerations means that the car is deccelerating.
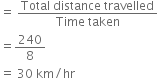
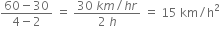
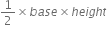
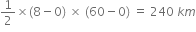
ii) Total distance travelled by the car (a) in 8 hours is,
Area of  =
= 
= 
iii) Average speed of the car (a) is,