The following is the distance-time table of a moving car. 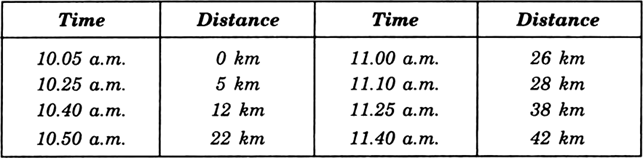
(i) Use a graph-paper and plot the distance travelled by the car versus time.
(ii) When was the car travelling with the greatest speed ?
(iii) What is the average speed of the car?
(iv) What is the speed between 11.25 a.m. and 11.40 a.m.?
(v) During a part of the journey, the car was forced to slow down to 12 km/h. At what distance did this happen?
(i) The distance-time graph for the motion of the car is as shown in the figure below.
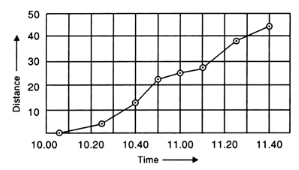
(ii) The car is travelling with maximum speed between 10.40 a.m. and 10.50 a.m.
During this time the distance-time graph has maximum slope.
Here
Speed of the car = 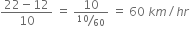
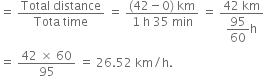
(iii) Average speed of car between 10.05 a.m. and 11.40 a.m.
(iv) Speed between 11.25 a.m. and 11.40 a.m.
(v) Between 11.00 a.m. to 11.10 a.m., the car was forced to slow down to 12 km/h.
So, this happened at a distance of 26 km.


