

The following table shows the ages of the patients admitted in a hospital during a year.
Find the mode and mean of the data given below. Compare and interpret the measures of central tendency.
|
Age (in yrs) |
No. of patients |
|
5-15 |
6 |
|
15-25 |
11 |
|
25-35 |
21 |
|
35-45 |
23 |
|
45-55 |
14 |
|
55-65 |
5 |
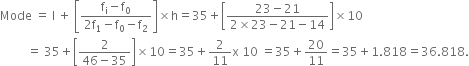
Case I: Finding the mode
Here, the maximum class frequency is 23 and the class corresponding to frequency is 35-45.
So, the modal class is 35-45.
Thus, we have
Modal class = 35 - 45
l = 35
fi = 23, f0 = 21, f2 = 14
and h = 10
Now, substituting these values in the formula of mode, we get
Case II : Finding the median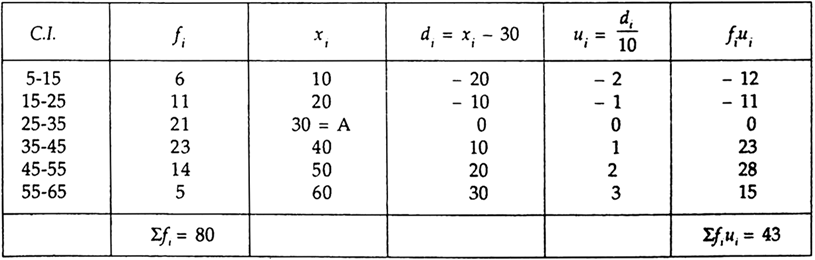
Now,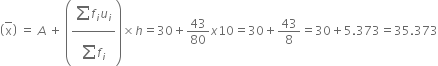
Hence, the mode of the given data is 36.818 while mean is 35.373.
Interpretation : Maximum number of patients admitted in the hospital are of the age 36.818 years, while an average age of patients admitted to the hospital is 35.373 yrs.


