-->

Proofs In Mathematics

Question
CBSEENMA9003830

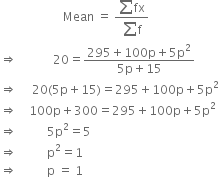
Find the value of p if mean of following distribution is 20.

X

f

15

2

17

3

19

4

20 + p

5p

23

6

Solution

ol.

x

f

fx

15

2

30

17

3

51

19

4

76

20 + p

5p

5p(20 + p)

23

6

138

Total

5p + 15

295 + l00p + 5p2


space space space space space space space space space space space space space space space space space space space space space Mean space equals space fraction numerator sum fx over denominator sum straight f end fraction
rightwards double arrow space space space space space space space space space space space space 20 equals fraction numerator 295 plus 100 straight p plus 5 straight p squared over denominator 5 straight p plus 15 end fraction
rightwards double arrow space space space space space 20 left parenthesis 5 straight p plus 15 right parenthesis equals 295 plus 100 straight p plus 5 straight p squared
rightwards double arrow space space space space 100 straight p plus 300 equals 295 plus 100 straight p plus 5 straight p squared
rightwards double arrow space space space space space space space space space space 5 straight p squared equals 5
rightwards double arrow space space space space space space space space space space straight p squared equals 1
rightwards double arrow space space space space space space space space space space straight p space equals space 1

Some More Questions From Proofs in Mathematics Chapter

Give five examples of data that you can collect from your day-to-day life.

Classify the data in Q. 1 above as primary or secondary data.

The blood groups of 30 students of Class VIII are recorded as follows:
A,B,O,O,AB,O,A O,B,A,O,B, A,O,O,
A,AB,O,A,A,O,O,AB,B,A,O,B,A,B.O.
Represent this data in the form of a frequency distribution table. Which is the most common and which is the rarest, blood group among these students.

The distance (in km) of 40 engineers from their residence to their place of work were found as follows:

5 3 10 20 25 11 13 7 12 31

19 10 12 17 18 11 32 17 16 2

7 9 7 8 3 5 12 15 18 3

12 14 2 9 6 15 15 7 6 12

Construct a grouped frequency distribution table with class size 5 for the data given above, taking the first interval as 0–5 (5 not included). What main features do you observe from this tabular representation ?

The relative humidity (in %) of a certain city for a month of 30 days is as follows:

98.1 98.6 99.2 90.3 86.5 95.3 92.9 96.3 94.2 95.1

89.2 92.3 97.1 93.5 92.7 95.1 97.2 93.3 95.2 97.3

96.2 92.1 84.9 90.2 95.7 98.3 97.3 96.1 92.1 89

(i) Construct a grouped frequency distribution table with classes 84-86, 86-88, etc.
(ii) Which month or season do you think this data is about?
(iii) What is the range of this data?

The heights of 50 students, measured to the nearest centimetres, have been found to be as follows:

161 150 154 165 168 161 154 162 150 151

162 164 171 165 158 154 156 172 160 170

153 159 161 170 162 165 166 168 165 164

154 152 153 156 158 162 160 161 173 166

161 159 162 167 168 159 158 153 154 159

(i) Represent the data given above by a grouped frequency distribution table, taking the class intervals as 160–165, 165–170, etc.
(ii) What can you conclude about their heights from the table?

A study was conducted to find out the concentration of sulphur dioxide in the air in parts per million (ppm) of a certain city. The data obtained for 30 days is as follows :

0.03 0.08 0.08 0.09 0.04 0.17

0.16 0.05 0.02 0.06 0.18 0.20

0.11 0.08 0.12 0.13 0.22 0.07

0.08 0.01 0.10 0.06 0.09 0.18

0.11 0.07 0.05 0.07 0.01 0.04

(i) Make a grouped frequency distribution table for this data with class intervals as 0.00–0.04, 0.04–0.08, and so on.
(ii) For how many days, was the concentration of sulphur dioxide more than 0.11 parts per million?

Three coins were tossed 30 times simultaneously. Each time the number of heads occurring was noted down as follows:

0 1 2 2 1 2 3 1 3 0

1 3 1 1 2 2 0 1 2 1

3 0 0 1 1 2 3 2 2 0

Prepare a frequency distribution table for the data given above.

The value of π 50 decimal places is given below:

3.14159265358979323846264338327950288419716939937510

(i) Make a frequency distribution of the digits from 0 to 9 after the decimal point.
(ii) What are the most and the least frequently occurring digits?

Thirty children were asked about the number of hours they watched TV programmes in the previous week. The results were found as follows:

1 6 2 3 5 1 2 5 8 4 8

10 3 4 12 2 8 15 1 17 6

3 2 8 5 9 6 8 7 14 12

(i) Make a grouped frequency distribution table for this data, taking class width 5 and one of the class intervals as 5–0.
(ii) How many children watched television for 15 or more hours a week?