Question
The following number of goals were scored by a team in a series of 10 matches :
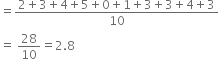
2, 3, 4, 5, 0, 1, 3, 3, 4, 3
Find the mean, median and mode of these scores.
Solution
(i) Mean

 Median
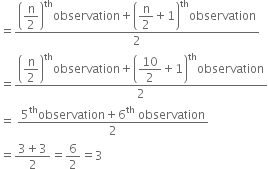
(ii) Median
Arranging the given data in ascending order, we have
0, 1, 2, 3, 3, 3, 3, 4, 4, 5
Number of observations (n) = 10, which is even.
Median(iii) Mode
Arranging the given data in ascending order, we have
0, 1, 2, 3, 3, 3, 3, 4, 4, 5
Here, 3 occurs most frequently (4 times)
∴ Mode = 3.


